Journal of Traditional Chinese Medicine ›› 2025, Vol. 45 ›› Issue (3): 493-507.DOI: 10.19852/j.cnki.jtcm.2025.03.007
Previous Articles Next Articles
Hamayou (Oviductus Ranae) protein hydrolysate ameliorates depression by regulating the mitogen-activated protein kinase pathway
LI Weijia1,2, LU Jing3, MA Chao3, LIU Mengmeng3, PEI Ke3, CHEN Hongyan4, LIN Zhe3, LYU Guangfu5( )
)
- 1 School of Pharmaceutical Sciences, Changchun University of Chinese Medicine, Changchun 130117, China
2 Research Center of Traditional Chinese Medicine, the Affiliated Hospital to Changchun University of Chinese Medicine, Changchun 130021, China
3 School of Pharmaceutical Sciences, Changchun University of Chinese Medicine, Changchun 130117, China
4 Affiliated Hospital to Changchun University of Chinese Medicine, Changchun 130021, China
5 Jilin Ginseng Academy, Changchun University of Chinese Medicine, Changchun 130117, China
-
Received:2024-06-16Accepted:2024-10-08Online:2025-06-15Published:2025-05-21 -
Contact:LYU Guangfu, Jilin Ginseng Academy, Changchun University of Chinese Medicine, Changchun 130117, China. lvgf@ccucm.edu.cn,Telephone: +86-19729360807
-
Supported by:Science and Technology Development Project of Jilin Province: Preparation and Evaluation of an Animal Model of Liver-depression Type Depression(20220505038ZP);Exploring the Material Basis and Action Pathway of the Antipyretic Effect of Baihu Tang based on Histologic Techniques(20240602036RC)
Cite this article
LI Weijia, LU Jing, MA Chao, LIU Mengmeng, PEI Ke, CHEN Hongyan, LIN Zhe, LYU Guangfu. Hamayou (Oviductus Ranae) protein hydrolysate ameliorates depression by regulating the mitogen-activated protein kinase pathway[J]. Journal of Traditional Chinese Medicine, 2025, 45(3): 493-507.
share this article
Table 1 Results of SPT, FST, TST analysis ($\bar{x}±s$)
| Group | n | SPT (%) | FST(s) | TST(s) |
|---|---|---|---|---|
| Control | 12 | 71±12 | 31±21 | 15±10 |
| Model | 12 | 41±14a | 195±24a | 131±33a |
| Fluoxetine | 12 | 65±3b | 52±24b | 29±24b |
| ORPH 0.8 g/kg | 12 | 64±10b | 58±30b | 30±17b |
| ORPH 0.4 g/kg | 12 | 61±11b | 77±39b | 37±21b |
| ORPH 0.2 g/kg | 12 | 57±14c | 106±28b | 47±29b |
Table 2 Results of OFT analysis ($\bar{x}±s$)
| Group | n | Movement distance (cm) | Central area activity time (s) | Corner area activity time (s) |
|---|---|---|---|---|
| Control | 12 | 1947±281 | 22±7 | 61±12 |
| Model | 12 | 1178±385a | 4±4a | 108±29a |
| Fluoxetine | 12 | 1917±305b | 33±16b | 56±20b |
| ORPH 0.8 g/kg | 12 | 1874±544b | 23±10b | 61±21b |
| ORPH 0.4 g/kg | 12 | 1673±304b | 18±11b | 73±22b |
| ORPH 0.2 g/kg | 12 | 1587±289c | 9±4c | 97±17c |
Table 3 Results of MWMT analysis ($\bar{x}±s$)
| Group | n | Escape latency (s) | Platform quadrant stay time (s) | Escape platform entry times |
|---|---|---|---|---|
| Control | 12 | 24.41±27.43 | 1.21±0.89 | 3.83±2.52 |
| Model | 12 | 113.01±15.55a | 0.30±0.28a | 0.70±0.67a |
| Fluoxetine | 12 | 62.73±49.03b | 0.79±0.47b | 2.27±1.19b |
| ORPH 0.8 g/kg | 12 | 59.81±35.90b | 0.78±0.46b | 2.91±1.38b |
| ORPH 0.4 g/kg | 12 | 85.00±37.30c | 0.65±0.40c | 2.00±1.10b |
| ORPH 0.2 g/kg | 12 | 90.85±41.43 | 0.64±0.67 | 1.88±1.55c |
Table 4 Changes in cerebral blood flow ($\bar{x}±s$)
| Group | n | Monitoring area (mm2) | Average cerebral blood perfusion | Areas under curve (PU*S) |
|---|---|---|---|---|
| Control | 12 | 319.4±3.3 | 70.9±14.8 | 4324.0±703.5 |
| Model | 12 | 319.9±10.3 | 70.9±14.8 | 4260.0±908.5 |
| Fluoxetine | 12 | 318.7±10.0 | 70.3±16.8 | 4239.4±1031.4 |
| ORPH 0.8 g/kg | 12 | 319.2±6.0 | 93.5±24.1a | 5628.6±1428.7a |
| ORPH 0.4 g/kg | 12 | 323.1±7.8 | 83.2±21.0 | 5036.9±1293.8 |
| ORPH 0.2 g/kg | 12 | 320.9±2.0 | 71.9±14.3 | 4301.9±856.3 |

Figure 1 ORPH effects on hippocampal organization. A: HE staining of mice hippocampal tissue (× 200). A1: Control group, A2: Model group, A3: Fluoxetine group, A4: ORPH 0.8 g/kg group, A5: ORPH 0.4 g/kg group, A6: ORPH 0.2 g/kg group. B: Tunel staining of mice hippocampal tissue (× 400). B1, B2, B3, B4, B5, B6: represent the DAPI staining of the hippocampus in the Control group, Model group, Fluoxetine group, ORPH 0.8 g/kg group, ORPH 0.4 g/kg group, ORPH 0.2 g/kg group of mice. B7, B8, B9, B10, B11, B12: represent the Tunel staining of the hippocampus in the Control group, Model group, Fluoxetine group, ORPH 0.8 g/kg group, ORPH 0.4 g/kg group, ORPH 0.2 g/kg group of mice. B13, B14, B15, B16, B17, B18: represent DAPI merged with Tunel staining of the hippocampus in the Control group, Model group, Fluoxetine group, ORPH 0.8 g/kg group, ORPH 0.4 g/kg group, ORPH 0.2 g/kg group of mice; C: the expression of Iba-1 in hippocampal tissue of mice (× 200). C1, C2, C3, C4, C5, C6: represent the DAPI staining of the hippocampus in the Control group, Model group, Fluoxetine group, ORPH 0.8 g/kg group, ORPH 0.4 g/kg group, ORPH 0.2 g/kg group of mice. C7, C8, C9, C10, C11, C12: represent the Iba-1 staining of the hippocampus in the Control group, Model group, Fluoxetine group, ORPH 0.8 g/kg group, ORPH 0.4 g/kg group, ORPH 0.2 g/kg group of mice. C13, C14, C15, C16, C17, C18: represent DAPI merged with Iba-1 staining of the hippocampus in the Control group, Model group, Fluoxetine group, ORPH 0.8 g/kg group, ORPH 0.4 g/kg group, ORPH 0.2 g/kg group of mice; D: analysis results of Tunel staining and Iba-1 Expression. D1: proportion of Tunel positive cells in B, D2: proportion of Iba-1 positive cells in C. Control: unstressed and intragastrically given 0.2 mL distilled water daily. Model: modeled and were intragastrically with distilled water. Fluoxetine: modeled and were intragastrically with Fluoxetine 3 mg/kg g·kg-1·d-1. ORPH 0.8 g/kg: modeled and were intragastrically with Hamayou (Oviductus Ranae) protein hydrolysate 0.8 g·kg-1·d-1. ORPH 0.4 g/kg: modeled and were intragastrically with Hamayou (Oviductus Ranae) protein hydrolysate 0.4 g·kg-1·d-1. ORPH 0.2 g/kg: modeled and were intragastrically with Hamayou (Oviductus Ranae) protein hydrolysate 0.2 g·kg-1·d-1. ORPH: Hamayou (Oviductus Ranae) protein hydrolysate; HE: hematoxylin-eosin; Tunel: TdT-mediated dUTP Nick-End Labeling; DAPI: 4',6-diamidino-2-phenylindole; Iba-1: Ionized calcium binding adapter molecule-1. Differences were evaluated by one-way analysis of variance. Data are presented as mean ± standard deviation (n = 6 in D1 and n = 5 in D2). aP < 0.01, compared with the Control group; bP < 0.01, compared with the model group.
Figure 1 ORPH effects on hippocampal organization. A: HE staining of mice hippocampal tissue (× 200). A1: Control group, A2: Model group, A3: Fluoxetine group, A4: ORPH 0.8 g/kg group, A5: ORPH 0.4 g/kg group, A6: ORPH 0.2 g/kg group. B: Tunel staining of mice hippocampal tissue (× 400). B1, B2, B3, B4, B5, B6: represent the DAPI staining of the hippocampus in the Control group, Model group, Fluoxetine group, ORPH 0.8 g/kg group, ORPH 0.4 g/kg group, ORPH 0.2 g/kg group of mice. B7, B8, B9, B10, B11, B12: represent the Tunel staining of the hippocampus in the Control group, Model group, Fluoxetine group, ORPH 0.8 g/kg group, ORPH 0.4 g/kg group, ORPH 0.2 g/kg group of mice. B13, B14, B15, B16, B17, B18: represent DAPI merged with Tunel staining of the hippocampus in the Control group, Model group, Fluoxetine group, ORPH 0.8 g/kg group, ORPH 0.4 g/kg group, ORPH 0.2 g/kg group of mice; C: the expression of Iba-1 in hippocampal tissue of mice (× 200). C1, C2, C3, C4, C5, C6: represent the DAPI staining of the hippocampus in the Control group, Model group, Fluoxetine group, ORPH 0.8 g/kg group, ORPH 0.4 g/kg group, ORPH 0.2 g/kg group of mice. C7, C8, C9, C10, C11, C12: represent the Iba-1 staining of the hippocampus in the Control group, Model group, Fluoxetine group, ORPH 0.8 g/kg group, ORPH 0.4 g/kg group, ORPH 0.2 g/kg group of mice. C13, C14, C15, C16, C17, C18: represent DAPI merged with Iba-1 staining of the hippocampus in the Control group, Model group, Fluoxetine group, ORPH 0.8 g/kg group, ORPH 0.4 g/kg group, ORPH 0.2 g/kg group of mice; D: analysis results of Tunel staining and Iba-1 Expression. D1: proportion of Tunel positive cells in B, D2: proportion of Iba-1 positive cells in C. Control: unstressed and intragastrically given 0.2 mL distilled water daily. Model: modeled and were intragastrically with distilled water. Fluoxetine: modeled and were intragastrically with Fluoxetine 3 mg/kg g·kg-1·d-1. ORPH 0.8 g/kg: modeled and were intragastrically with Hamayou (Oviductus Ranae) protein hydrolysate 0.8 g·kg-1·d-1. ORPH 0.4 g/kg: modeled and were intragastrically with Hamayou (Oviductus Ranae) protein hydrolysate 0.4 g·kg-1·d-1. ORPH 0.2 g/kg: modeled and were intragastrically with Hamayou (Oviductus Ranae) protein hydrolysate 0.2 g·kg-1·d-1. ORPH: Hamayou (Oviductus Ranae) protein hydrolysate; HE: hematoxylin-eosin; Tunel: TdT-mediated dUTP Nick-End Labeling; DAPI: 4',6-diamidino-2-phenylindole; Iba-1: Ionized calcium binding adapter molecule-1. Differences were evaluated by one-way analysis of variance. Data are presented as mean ± standard deviation (n = 6 in D1 and n = 5 in D2). aP < 0.01, compared with the Control group; bP < 0.01, compared with the model group.
Table 5 Serum levels of CORT, IL-1β, IL-6, TNF-α, 5-HT and NE in each group ($\bar{x}±s$)
| Group | n | CORT (μg/L) | IL-1β (ng/L) | IL-6 (ng/L) | TNF-α (ng/L) | NE (ng/mL) | 5-HT (ng/mL) |
|---|---|---|---|---|---|---|---|
| Control | 12 | 65±4 | 43±14 | 157±22 | 598±126 | 34±7 | 78±12 |
| Model | 12 | 78±5a | 80±33a | 208±23a | 895±333a | 22±3a | 53±9a |
| Fluoxetine | 12 | 67±7b | 43±15b | 173±11b | 592±112c | 30±6b | 74±6c |
| ORPH 0.8 g/kg | 12 | 66±7b | 42±16b | 162±19b | 551±174b | 29±5b | 73±15b |
| ORPH 0.4 g/kg | 12 | 69±5b | 47±10b | 178±19b | 576±179c | 27±6c | 69±10b |
| ORPH 0.2 g/kg | 12 | 70±10c | 52±20c | 185±7b | 614±164c | 25±8 | 65±13c |

Figure 2 Regulation of inflammatory factors and MAPK signaling pathways by ORPH in depression model mice A: p38 and p-p38 proteins expression in hippocampal tissue assessed by Western blot. A1: representative band of p38 and p-p38 proteins detected by WB, A2: p-p38 decreased after treatment; B: JNK and p-JNK proteins expression in hippocampal tissue assessed by Western blot. B1: representative band of JNK and p-JNK proteins detected by WB, B2: p-JNK decreased after treatment; C: ERk and p-ERK proteins expression in hippocampal tissue assessed by Western blot. C1: representative band of ERK and p-ERK proteins detected by WB, C2: p-ERK increased after treatment; D: NF-κb and IκB-α proteins expression in hippocampal tissue assessed by Western blot. D1: representative band of NF-κb and IκB-α proteins detected by WB, D2: NF-κb decreased after treatment, D3: IκB-α increased after treatment; E: Caspase9, BCL-2, BAX and Caspase3 proteins expression in hippocampal tissue assessed by Western blot. E1: representative band of Caspase9, BCL-2, BAX and Caspase3 proteins detected by WB, E2: Caspase9 decreased after treatment, E3: BCL-2 increased after treatment, E4: BAX decreased after treatment, E5: Caspase3 decreased after treatment. Control: unstressed and intragastrically given 0.2 mL distilled water daily. Model: modeled and were intragastrically with distilled water. Fluoxetine: modeled and were intragastrically with Fluoxetine 3 mg/kg g·kg-1·d-1. ORPH 0.8 g/kg: modeled and were intragastrically with Hamayou (Oviductus Ranae) protein hydrolysate 0.8 g·kg-1·d-1. ORPH 0.4 g/kg: modeled and were intragastrically with Hamayou (Oviductus Ranae) protein hydrolysate 0.4 g·kg-1·d-1. ORPH 0.2 g/kg: modeled and were intragastrically with Hamayou (Oviductus Ranae) protein hydrolysate 0.2 g·kg-1·d-1. P38: P38 MAPK; JNK: C-Jun N-terminal kinase; ERK: extracellular signal-regulated kinase; NF-κB: nuclear factor-κB; IκB-α: inhibitor of NF-κB; Bcl-2: B-cell lymphoma-2; BAX: Bcl-2-associated X. Differences were evaluated by one-way analysis of variance; Data are presented as mean ± standard deviation (n = 3); aP < 0;01, compared with the Control group; bP < 0;01, cP < 0;05, compared with the Model group.
Figure 2 Regulation of inflammatory factors and MAPK signaling pathways by ORPH in depression model mice A: p38 and p-p38 proteins expression in hippocampal tissue assessed by Western blot. A1: representative band of p38 and p-p38 proteins detected by WB, A2: p-p38 decreased after treatment; B: JNK and p-JNK proteins expression in hippocampal tissue assessed by Western blot. B1: representative band of JNK and p-JNK proteins detected by WB, B2: p-JNK decreased after treatment; C: ERk and p-ERK proteins expression in hippocampal tissue assessed by Western blot. C1: representative band of ERK and p-ERK proteins detected by WB, C2: p-ERK increased after treatment; D: NF-κb and IκB-α proteins expression in hippocampal tissue assessed by Western blot. D1: representative band of NF-κb and IκB-α proteins detected by WB, D2: NF-κb decreased after treatment, D3: IκB-α increased after treatment; E: Caspase9, BCL-2, BAX and Caspase3 proteins expression in hippocampal tissue assessed by Western blot. E1: representative band of Caspase9, BCL-2, BAX and Caspase3 proteins detected by WB, E2: Caspase9 decreased after treatment, E3: BCL-2 increased after treatment, E4: BAX decreased after treatment, E5: Caspase3 decreased after treatment. Control: unstressed and intragastrically given 0.2 mL distilled water daily. Model: modeled and were intragastrically with distilled water. Fluoxetine: modeled and were intragastrically with Fluoxetine 3 mg/kg g·kg-1·d-1. ORPH 0.8 g/kg: modeled and were intragastrically with Hamayou (Oviductus Ranae) protein hydrolysate 0.8 g·kg-1·d-1. ORPH 0.4 g/kg: modeled and were intragastrically with Hamayou (Oviductus Ranae) protein hydrolysate 0.4 g·kg-1·d-1. ORPH 0.2 g/kg: modeled and were intragastrically with Hamayou (Oviductus Ranae) protein hydrolysate 0.2 g·kg-1·d-1. P38: P38 MAPK; JNK: C-Jun N-terminal kinase; ERK: extracellular signal-regulated kinase; NF-κB: nuclear factor-κB; IκB-α: inhibitor of NF-κB; Bcl-2: B-cell lymphoma-2; BAX: Bcl-2-associated X. Differences were evaluated by one-way analysis of variance; Data are presented as mean ± standard deviation (n = 3); aP < 0;01, compared with the Control group; bP < 0;01, cP < 0;05, compared with the Model group.
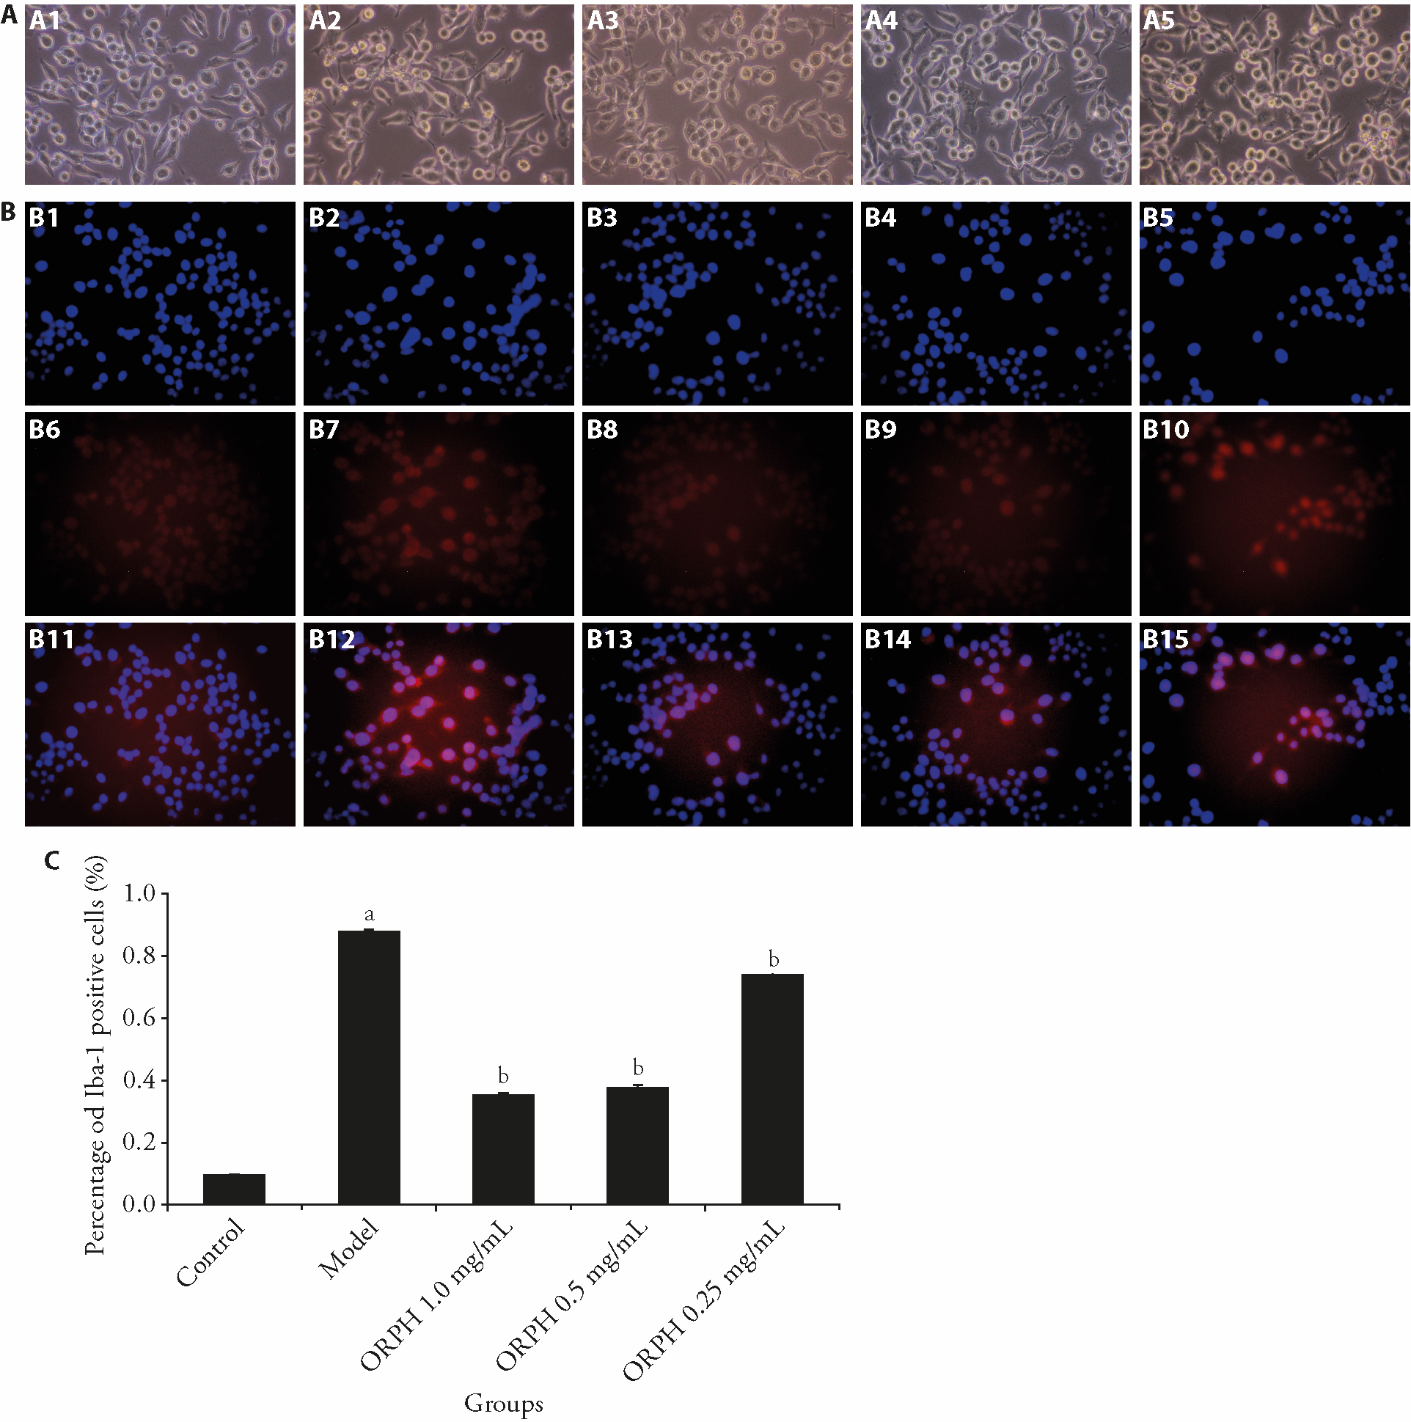
Figure 3 Effect of ORPH on BV2 cells A: the effect of ORPH on the morphology of BV2 cells over a period of 24 h (× 200); B: expression of Iba-1 in BV2 cells (× 200); C: proportion of Iba-1 positive cells in B. A1: control group; A2: model group; A3: ORPH 1.0 mg/mL group; A4: ORPH 0.5 mg/mL group; A5: ORPH 0.25 mg/mL group. B1, B2, B3, B4, B5: represent the DAPI staining of BV2 cells in the Control group, Model group, ORPH 1.0 mg/mL group, ORPH 0.5 mg/mL group, ORPH 0.25 mg/mL group. B6, B7, B8, B9, B10: represent the Iba-1 staining of BV2 cells in the Control group, Model group, ORPH 1.0 mg/mL group, ORPH 0.5 mg/mL group, ORPH 0.25 mg/mL group. B11, B12, B13, B14, B15: represent the DAPI merged with Iba-1 staining of BV2 cells in the Control group, Model group, ORPH 1.0 mg/mL group, ORPH 0.5 mg/mL group, ORPH 0.25 mg/mL group. Control: BV2 cells in complete medium without LPS or ORPH. Model: BV2 cells in complete medium with LPS (200 ng/mL) for 24 h. ORPH 1.0 mg/mL: BV2 cells in complete medium with LPS (200 ng/mL) and Hamayou (Oviductus Ranae) protein hydrolysate 1.0 mg/mL for 24 h. ORPH 0.5 mg/mL: BV2 cells in complete medium with LPS (200 ng/mL) and Hamayou (Oviductus Ranae) protein hydrolysate 0.5 mg/mL for 24 h. ORPH 0.25 mg/mL: BV2 cells in complete medium with LPS (200 ng/mL) and Hamayou (Oviductus Ranae) protein hydrolysate 0.25 mg/mL for 24 h. ORPH: Hamayou (Oviductus Ranae) protein hydrolysate; DAPI: 4',6-diamidino-2-phenylindole; Iba-1: Ionized calcium binding adapter molecule-1. Differences were evaluated by one-way analysis of variance. Data are presented as mean ± standard deviation (n = 3). aP < 0.01, compared with the Control group; bP < 0.01, compared with the Model group.
Figure 3 Effect of ORPH on BV2 cells A: the effect of ORPH on the morphology of BV2 cells over a period of 24 h (× 200); B: expression of Iba-1 in BV2 cells (× 200); C: proportion of Iba-1 positive cells in B. A1: control group; A2: model group; A3: ORPH 1.0 mg/mL group; A4: ORPH 0.5 mg/mL group; A5: ORPH 0.25 mg/mL group. B1, B2, B3, B4, B5: represent the DAPI staining of BV2 cells in the Control group, Model group, ORPH 1.0 mg/mL group, ORPH 0.5 mg/mL group, ORPH 0.25 mg/mL group. B6, B7, B8, B9, B10: represent the Iba-1 staining of BV2 cells in the Control group, Model group, ORPH 1.0 mg/mL group, ORPH 0.5 mg/mL group, ORPH 0.25 mg/mL group. B11, B12, B13, B14, B15: represent the DAPI merged with Iba-1 staining of BV2 cells in the Control group, Model group, ORPH 1.0 mg/mL group, ORPH 0.5 mg/mL group, ORPH 0.25 mg/mL group. Control: BV2 cells in complete medium without LPS or ORPH. Model: BV2 cells in complete medium with LPS (200 ng/mL) for 24 h. ORPH 1.0 mg/mL: BV2 cells in complete medium with LPS (200 ng/mL) and Hamayou (Oviductus Ranae) protein hydrolysate 1.0 mg/mL for 24 h. ORPH 0.5 mg/mL: BV2 cells in complete medium with LPS (200 ng/mL) and Hamayou (Oviductus Ranae) protein hydrolysate 0.5 mg/mL for 24 h. ORPH 0.25 mg/mL: BV2 cells in complete medium with LPS (200 ng/mL) and Hamayou (Oviductus Ranae) protein hydrolysate 0.25 mg/mL for 24 h. ORPH: Hamayou (Oviductus Ranae) protein hydrolysate; DAPI: 4',6-diamidino-2-phenylindole; Iba-1: Ionized calcium binding adapter molecule-1. Differences were evaluated by one-way analysis of variance. Data are presented as mean ± standard deviation (n = 3). aP < 0.01, compared with the Control group; bP < 0.01, compared with the Model group.
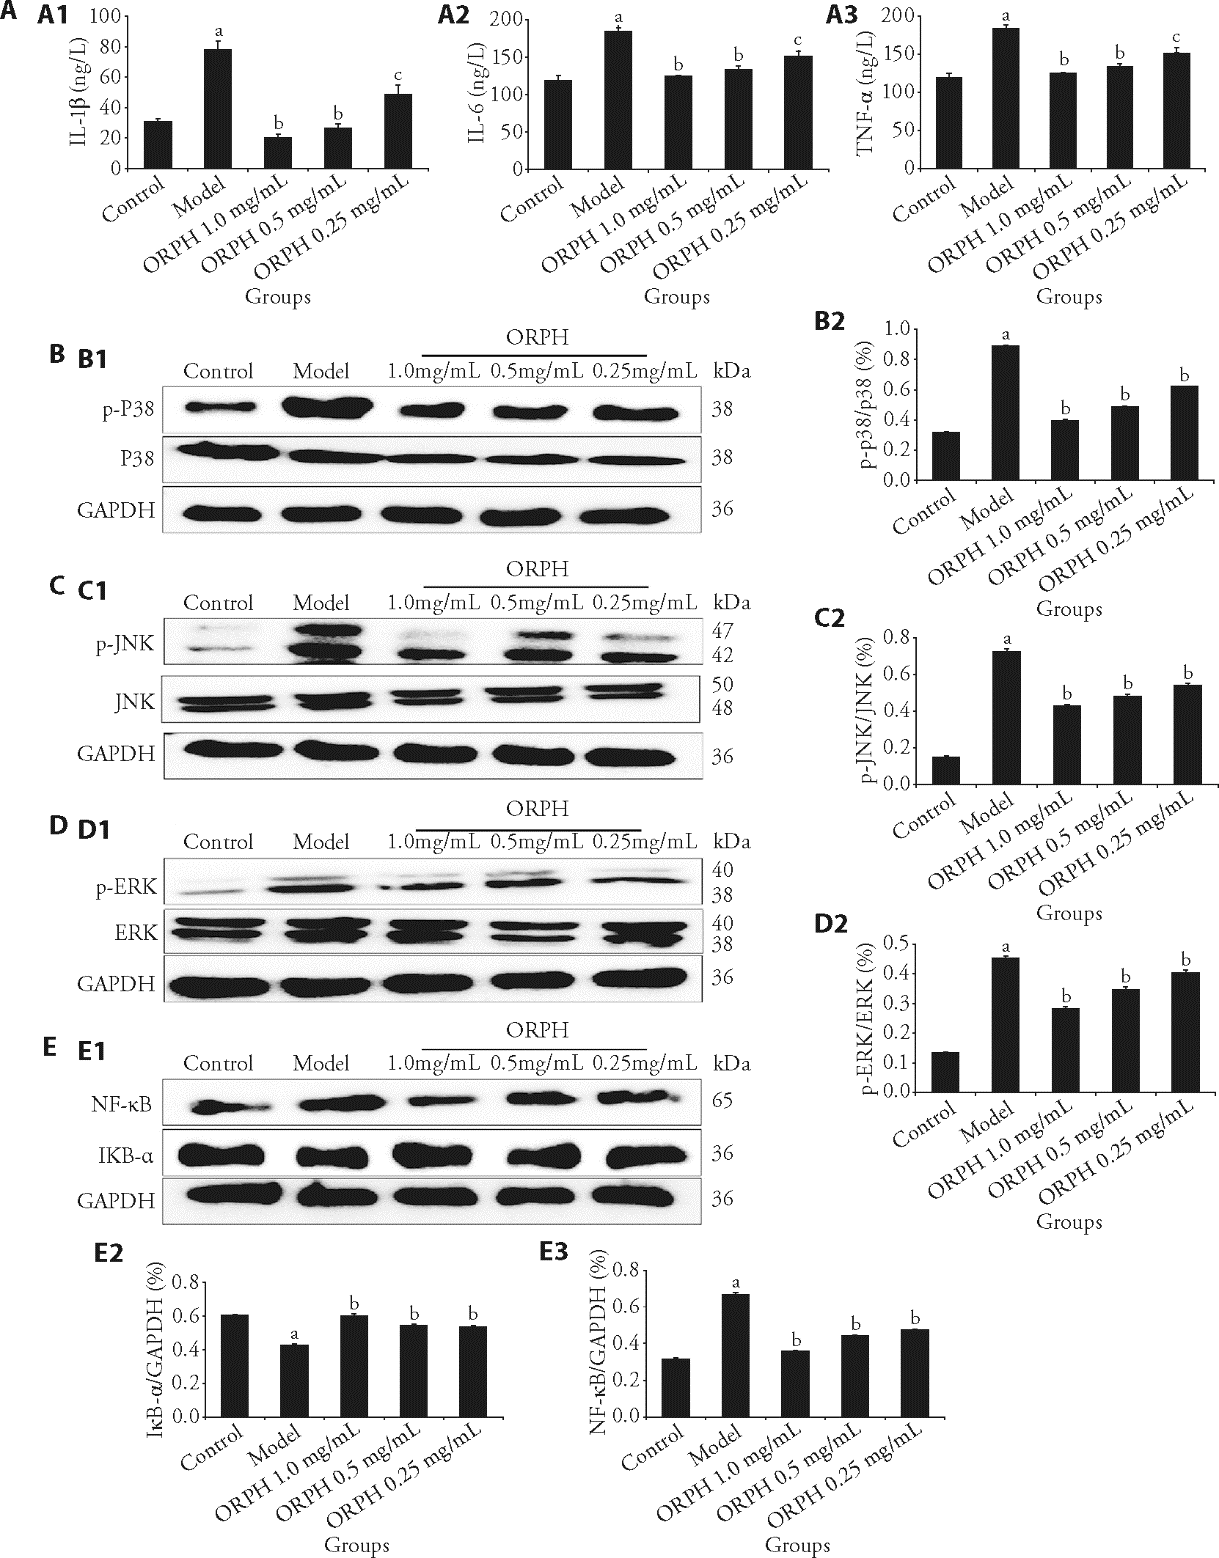
Figure 4 Regulation of inflammatory factors and MAPK signaling pathways by ORPH in BV2 cells A: effect of ORPH on inflammatory factor level in BV2 cell supernatant; B: protein expression bands of p38 in BV2 Cells; C: protein expression bands of JNK in BV2 Cells; D: protein expression bands of ERK in BV2 Cells; E: protein expression bands of NF-κB, IκB-α in BV2 Cells. A1: IL-1β decreased after treatment, A2: IL-6 decreased after treatment, A3: TNF-α decreased after treatment. B1: representative band of p38 and p-p38 proteins detected by WB, B2: p-p38 decreased after treatment. C1: representative band of JNK and p-JNK proteins detected by WB, C2: p-JNK decreased after treatment. D1: representative band of ERK and p-ERK proteins detected by WB, D2: p-ERK decreased after treatment. E1: representative band of IκB-α and NF-κB proteins detected by WB, E2: IκB-α increased after treatment, E3: NF-κB decreased after treatment. Control: BV2 cells in complete medium without LPS or ORPH. Model: BV2 cells in complete medium with LPS (200 ng/mL) for 24 h. ORPH 1.0 mg/mL: BV2 cells in complete medium with LPS (200 ng/mL) and Hamayou (Oviductus Ranae) protein hydrolysate 1.0 mg/mL for 24 h. ORPH 0.5 mg/mL: BV2 cells in complete medium with LPS (200 ng/mL) and Hamayou (Oviductus Ranae) protein hydrolysate 0.5 mg/mL for 24 h. ORPH 0.25 mg/mL: BV2 cells in complete medium with LPS (200 ng/mL) and Hamayou (Oviductus Ranae) protein hydrolysate 0.25 mg/mL for 24 h. MAPK: mitogen-activated protein kinase; ORPH: Hamayou (Oviductus Ranae) protein hydrolysate; IL-1β: interleukin-1β; IL-6: interleukin-6; TNF-α: tumor necrosis factor-α; JNK: C-Jun N-terminal kinase; ERK: extracellular signal-regulated kinase; GAPDH: glyceraldehyde-3-phosphate dehydrogenase; NF-κB: nuclear factor-κB; IκB-α: inhibitor of NF-κB; Bcl-2: B-cell lymphoma-2; BAX: Bcl-2-associated X. Differences were evaluated by one-way analysis of variance. Data are presented as mean ± standard deviation (n = 3). aP < 0.01, compared with the Control group; bP < 0.01, cP < 0.05 compared with the Model group.
Figure 4 Regulation of inflammatory factors and MAPK signaling pathways by ORPH in BV2 cells A: effect of ORPH on inflammatory factor level in BV2 cell supernatant; B: protein expression bands of p38 in BV2 Cells; C: protein expression bands of JNK in BV2 Cells; D: protein expression bands of ERK in BV2 Cells; E: protein expression bands of NF-κB, IκB-α in BV2 Cells. A1: IL-1β decreased after treatment, A2: IL-6 decreased after treatment, A3: TNF-α decreased after treatment. B1: representative band of p38 and p-p38 proteins detected by WB, B2: p-p38 decreased after treatment. C1: representative band of JNK and p-JNK proteins detected by WB, C2: p-JNK decreased after treatment. D1: representative band of ERK and p-ERK proteins detected by WB, D2: p-ERK decreased after treatment. E1: representative band of IκB-α and NF-κB proteins detected by WB, E2: IκB-α increased after treatment, E3: NF-κB decreased after treatment. Control: BV2 cells in complete medium without LPS or ORPH. Model: BV2 cells in complete medium with LPS (200 ng/mL) for 24 h. ORPH 1.0 mg/mL: BV2 cells in complete medium with LPS (200 ng/mL) and Hamayou (Oviductus Ranae) protein hydrolysate 1.0 mg/mL for 24 h. ORPH 0.5 mg/mL: BV2 cells in complete medium with LPS (200 ng/mL) and Hamayou (Oviductus Ranae) protein hydrolysate 0.5 mg/mL for 24 h. ORPH 0.25 mg/mL: BV2 cells in complete medium with LPS (200 ng/mL) and Hamayou (Oviductus Ranae) protein hydrolysate 0.25 mg/mL for 24 h. MAPK: mitogen-activated protein kinase; ORPH: Hamayou (Oviductus Ranae) protein hydrolysate; IL-1β: interleukin-1β; IL-6: interleukin-6; TNF-α: tumor necrosis factor-α; JNK: C-Jun N-terminal kinase; ERK: extracellular signal-regulated kinase; GAPDH: glyceraldehyde-3-phosphate dehydrogenase; NF-κB: nuclear factor-κB; IκB-α: inhibitor of NF-κB; Bcl-2: B-cell lymphoma-2; BAX: Bcl-2-associated X. Differences were evaluated by one-way analysis of variance. Data are presented as mean ± standard deviation (n = 3). aP < 0.01, compared with the Control group; bP < 0.01, cP < 0.05 compared with the Model group.
| 1. | Marwaha S, Palmer E, Suppes T, Cons E, Young AH, Upthegrove R. Novel and emerging treatments for major depression. Lancet 2023; 10371: 141-53. |
| 2. | Delgado P. Depression: the case for a monoamine deficiency. J Clin Psychiatry 2000; 61: 7-11. |
| 3. |
Parker K, Schatzberg A, Lyons D. Neuroendocrine aspects of hypercortisolism in major depression. Horm Behav 2003; 43: 60-6.
DOI PMID |
| 4. | Zutphen E, Rhebergen D, Exel E, et al. Brain-derived neurotrophic factor as a possible predictor of electroconvulsive therapy outcome. Transl Psychiatry 2019; 9: 155. |
| 5. |
Majidi J, Kosari-Nasab M, Salari A. Developmental minocycline treatment reverses the effects of neonatal immune activation on anxiety- and depression-like behaviors, hippocampal inflammation, and HPA axis activity in adult mice. Brain Res Bull 2016; 120: 1-13.
DOI PMID |
| 6. |
Vetencourt J, Sale A, Viegi A, et al. The antidepressant fluoxetine restores plasticity in the adult visual cortex. Science 2008; 320: 385-8.
DOI PMID |
| 7. |
Kim E, Choi E. Pathological roles of MAPK signaling pathways in human diseases. Biochim Biophys Acta 2010; 1802: 396-405.
DOI PMID |
| 8. | Asl E, Amini M, Najafi S, et al. Interplay between MAPK/ERK signaling pathway and MicroRNAs: a crucial mechanism regulating cancer cell metabolism and tumor progression. Life Sci 2021; 278: 119499. |
| 9. |
Jia Z, Yang J, Cao Z, et al. Baicalin ameliorates chronic unpredictable mild stress-induced depression through the BDNF/ERK/CREB signaling pathway. Behav Brain Res 2021; 414: 113463.
DOI PMID |
| 10. |
Kyriakis J, Avruch J. Mammalian mitogen-activated protein kinase signal transduction pathways activated by stress and inflammation. Physiol Rev 2001; 81: 807-69.
DOI PMID |
| 11. | Madhu L, Kodali M, Attaluri S, et al. Melatonin improves brain function in a model of chronic gulf war illness with modulation of oxidative stress, NLRP3 inflammasomes, and BDNF-ERK-CREB pathway in the hippocampus. Redox Biol 2021; 43: 101973. |
| 12. | Kasuya Y, Umezawa H, Hatano M. Stress-activated protein kinases in spinal cord injury: focus on roles of p38. Int J Mol Sci 2018; 19: 867. |
| 13. | Zhang F, Wang M, Zha Y, Zhou J, Han J, Zhang S. Daucosterol alleviates alcohol-induced hepatic injury and inflammation through P38/NF-κB/NLRP3 inflammasome pathway. Nutrients 2023; 15: 223. |
| 14. | Yarza R, Vela S, Solas M, Ramirez MJ. c-Jun n-terminal kinase (JNK) signaling as a therapeutic target for alzheimer’s disease. Front Pharmacol 2016; 6: 321. |
| 15. | Jeong H, Kim J, Lee U, et al. Leaves of cedrela sinensis attenuate chronic unpredictable mild stress-induced depression-like behavior via regulation of hormonal and inflammatory imbalance. Antioxidants 2022; 11: 2448. |
| 16. | Xing Y, Guo J, Guo W. Butylphthalide regulation of nerve cells in rats with cerebral infarction through jnk/p38mapk signaling pathway. Pak J Pharm Sci 2023; 36: 665-71. |
| 17. | S. P. Committee. Pharmacopoeia of the People’s Republic of China, Beijing, China Medical Science Press, 2015: 255. |
| 18. | Liu H, Zhang J, Li Y, Deng M. A survey of the original animal of Hashima-frog. Changchun Zhong Yi Yao Da Xue Xue Bao 2012; 28: 541-3. |
| 19. | Zhang Y, Zhu K, Cui H, et al. Toxicological evaluation of Hamayou (Oviductus Ranae): acute, sub-acute and genotoxicity studies in mice and rats. J Ethnopharmacology 2017; 203: 101-9. |
| 20. | Xiao J, Liu Y, Chang H, Jiang D. Progress in the study of the pharmacological effects of Hamayou (Oviductus Ranae), a valuable animal medicine. Jilin Zhong Yi Yao 2012; 32:751-3. |
| 21. | Niu Y, Xu X. Overview of pharmacological actions of Chinese Hamayou (Oviductus Ranae). Zhong Guo Yao Shi 2010; 13: 568-9. |
| 22. | Ling X, Zhang X, Tan Y, et al. Protective effects of Hamayou (Oviductus Ranae)-containing serum on oxidative stress-induced apoptosis in rat ovarian granulosa cells. J Ethnopharmacology 2017; 208: 138-48. |
| 23. | Li E, Wang J, Lei Z. Overview of the use of acupuncture point by Du Mai in the treatment of encephalopathy in the last decade. Shanxi Zhong Yi Yao Da Xue Xue Bao 2022; 45:160-4. |
| 24. | Zhang H, Xie XH, Xu SX, et al. Oligodendrocyte-derived exosomes-containing SIRT2 ameliorates depressive-like behaviors and restores hippocampal neurogenesis and synaptic plasticity via the AKT/GSK-3β pathway in depressed mice. CNS Neurosci Ther 2024; 30:e14661. |
| 25. | Tang E, Lau A, Au D, et al. Effects of Acupuncture upon cerebral hemodynamics in cerebral small vessel disease: A pilot study. Cereb Circ Cogn Behav 2023; 4:100168. |
| 26. | Yu B, Sun Y, Lyu G, Lu J, Fang T. Influence of electroacupuncture plus intragastric administration of extract of hypericum perforatum L on ethology and brain microcirculation in depression rats. Zhen Ci Yan Jiu 2011; 36: 164-70. |
| 27. | Maes M, Meltzer H, Scharpe S, et al. Relationships between lower plasma L-tryptophanlevels and immune-inflammatory variables in depression. Psychiatry Res 1993; 49: 151-65. |
| 28. |
Benrick A, Schele E, Wernstedt-Asterholm I, et al. Interleukin-6 gene knockout influences energy balance regulating peptides in the hypothalamic paraventricular and supraoptic nuclei. J Neuroendocrinol 2009; 21: 620-8.
DOI PMID |
| 29. | Xu W, Yao X, Zhao F, et al. Changes in hippocampal plasticity in depression and therapeutic approaches influencing these changes. Neural Plast 2020; 2020: 8861903 |
| 30. | Mizuseki K, Royer S, Diba K, Buzsaki G. Activity dynamics and behavioral correlates of CA3 and CA1 hippocampal pyramidal neurons. Hippocampus 2012; 22: 221659-80. |
| 31. | Maes M, Yirmyia R, Noraberg J, et al. The inflammatory & neurodegenerative (I&ND) hypothesis of depression: leads for future research and new drug developments in depression. Metab Brain Dis 2009; 24: 27-53. |
| 32. | Song C, Wang H. Cytokines mediated inflammation and decreased neurogenesis in animal models of depression. Prog Neuropsychopharmacol Biol Psychiatry 2010; 35: 760-8. |
| 33. | Lu J, Yu M, Li J. PKC-δ Promotes IL-1β-Induced apoptosis of rat chondrocytes and via activating JNK and P38 MAPK Pathways. Cartilage. 2024; 15: 315-27. |
| 34. | Campbell KJ, Tait SWG. Targeting BCL-2 regulated apoptosis in cancer. Open Biol 2018; 8: 180002. |
| 35. |
Jiang H, Zhao P, Su D, Ma SL. Paris saponin I induces apoptosis via increasing the Bax/Bcl-2 ratio and caspase-3 expression in gefitinib-resistant non-small cell lung cancer in vitro and in vivo. Mol Med Rep 2014; 9: 2265-72.
DOI PMID |
| 36. | Meng L, Ma H, Meng J, Li T, Zhu Y, Zhao Q. Costunolide attenuates oxygen-glucose deprivation/reperfusion-induced mitochondrial-mediated apoptosis in PC12 cells. Mol Med Rep 2021; 23: 411. |
| 37. |
Eltzschig HK, Eckle T. Ischemia and reperfusion-from mechanism to translation. Nat Med 2011; 17:1391-401.
DOI PMID |
| 38. | Steiner J, Walter M, Gos T, et al. Severe depression is associated with increased microglial quinolinic acid in subregions of the anterior cingulate gyrus: evidence for an immune-modulated glutamatergic neurotransmission. J Neuroinflammation 2011; 8: 84. |
| 39. |
Steiner J, Bielau H, Brisch R, et al. Immunological aspects in the neurobiology of suicide: elevated microglial density in schizophrenia and depression is associated with suicide. J Psychiatr Res 2008; 42: 151-7.
DOI PMID |
| 40. |
Crotti A, Ransohoff MR. Microglial physiology and pathophysiology: insights from genome-wide transcriptional profiling. Immunity 2016; 44: 505-15.
DOI PMID |
| 41. | Boche D, Perry VH, Nicoll JAR. Review: activation patterns of microglia and their identification in the human brain. Neuropathol Appl Neurobiol 2013; 39: 3-18. |
| 42. | Pascual O, Achour SB, Rostaing P, Triller A, Bessis A. Microglia activation triggers astrocyte-mediated modulation of excitatory neurotransmission. Proc NatI Acade Sci USA 2012; 109: E197-205. |
| 43. |
Green FH, Nolan MY. Inflammation and the developing brain: consequences for hippocampal neurogenesis and behavior. Neurosci Biobehav Rev 2014; 40: 20-34.
DOI PMID |
| 44. | Lu K, Cheng N, Wu C, Yang Y. NKCC1-mediated traumatic brain injury-induced brain edema and neuron death via Raf/MEK/MAPK cascade. Crit Care Med 2008; 36: 917-22. |
| 45. | Wang S, Gan Y, Mao X. Antioxidant activity evaluation of Hamayou (Oviductus Ranae) protein hydrolyzed by different proteases. Molecules 2021; 26: 1625. |
| 46. |
Willner P, Towell A, Sampson D, Sophokleous S, Muscat R. Reduction of sucrose preference by chronic unpredictable mild stress, and its restoration by a tricyclic antidepressant. Psychopharmacology 1987; 93: 358-64.
DOI PMID |
| 47. |
Li J, Sha L, Xu Q. An early increase in glutamate is critical for the development of depression-like behavior in a chronic restraint stress (CRS) model. Brain Res Bull 2020; 162: 59-66.
DOI PMID |
| 48. |
Steru L, Chermat R, Thierry B, Simson P. The tail suspension test: a new method for screening antidepressants in mice. Psychopharmacology 1985; 85: 367-70.
DOI PMID |
| 49. | Pei H, Shen H, Bi J, He Z, Zhai L. Gastrodin improves nerve cell injury and behaviors of depressed mice through Caspase-3-mediated apoptosis. CNS Neurosci Ther 2024; 30: e14444. |
| 50. | Wang K, Zhang H, Du Y. MEX3C induces cognitive impairment in mice through autophagy inhibition. Brain Behav 2023; 13: e3245. |
| Viewed | ||||||
|
Full text |
|
|||||
|
Abstract |
|
|||||