Journal of Traditional Chinese Medicine ›› 2022, Vol. 42 ›› Issue (6): 940-947.DOI: 10.19852/j.cnki.jtcm.2022.06.007
• Research Articles • Previous Articles Next Articles
Effect of Dangfei Liganning capsule (当飞利肝宁胶囊) on liver X receptor α/steroid regulatory element binding protein-1/fatty acid synthase signal pathway in rats with metabolic- associated fatty liver disease
LI Xiaoling1, SUN Fengxia1( ), SHANG Zimeng1, ZHANG Yingxue1, LI Jie1, ZHANG Qiuxiang2
- 1 Infections Department, Beijing Hospital of Traditional Chinese Medicine, Capital Medical University, Beijing 100010, China
2 Infections Department, Beijing Hospital of Traditional Chinese Medicine Shunyi Branch, Beijing 101300, China
-
Received:2021-08-12Accepted:2021-11-27Online:2022-12-15Published:2022-11-01 -
Contact:SUN Fengxia,SHANG Zimeng,ZHANG Yingxue,LI Jie,ZHANG Qiuxiang -
About author:Pro. SUN Fengxia, Infections Department, Beijing Hospital of Traditional Chinese Medicine, Capital Medical University, Beijing 100010, China. sunfengxia01969@163.com, Telephone: +86-10-87906608
-
Supported by:Capital Health Development Research Project: Assessment of the Efficacy of BIEJIAJIANWAN Pill in Patients with Chronic Hepatitis B Cirrhosis/Fibrosis(CD2018-2-2173);Beijing Municipal Administration of Hospitals Incubating Program: Clinical Observation on the Treatment of Nonalcoholic Fatty Liver Disease by Invigorating the Spleen, Soothing the Liver, Activating Blood Circulation and Resolving Phlegm(PZ2019011)
Cite this article
LI Xiaoling, SUN Fengxia, SHANG Zimeng, ZHANG Yingxue, LI Jie, ZHANG Qiuxiang. Effect of Dangfei Liganning capsule (当飞利肝宁胶囊) on liver X receptor α/steroid regulatory element binding protein-1/fatty acid synthase signal pathway in rats with metabolic- associated fatty liver disease[J]. Journal of Traditional Chinese Medicine, 2022, 42(6): 940-947.
share this article
Table 1 Changes in body weight of rats in each group (g, $\bar{x} \pm s$)
| Group | n | Week 0 | Week 2 | Week 4 | Week 6 | Week 8 |
|---|---|---|---|---|---|---|
| Normal | 8 | 218±7 | 318±8 | 405±5 | 502±4 | 578±8 |
| Model | 8 | 218±6 | 324±5a | 421±3a | 524±7 | 602±7 |
| Dangfei-L | 8 | 216±6 | 322±4a | 418±6a | 524±7 | 601±8 |
| Dangfei-M | 8 | 220±6 | 323±4a | 419±4a | 522±6 | 601±8 |
| Dangfei-H | 8 | 219±3 | 313±4b | 404±4b | 476±4c | 537±4c |
| Essentiale | 8 | 217±7 | 317±11b | 414±6b | 516±7 | 578±4 |
Table 2 Changes of liver function and blood lipids of rats in each group ($\bar{x} \pm s$)
| Group | n | TG (mmol/L) | CHO (mmol/L) | HDL-C (mmol/L) | LDL-C (mmol/L) | ALT (U/L) | AST (U/L) |
|---|---|---|---|---|---|---|---|
| Normal | 8 | 0.33±0.12 | 2.10±0.42 | 1.06±0.16 | 0.33±0.10 | 3.40±0.81 | 10.61±1.17 |
| Model | 8 | 0.89±0.23a | 5.68±0.71a | 0.61±0.14a | 0.72±0.11a | 9.98±2.26a | 23.62±4.82a |
| Dangfei-L | 8 | 0.95±0.26 | 5.61±0.71 | 0.58±0.12 | 0.69±0.11 | 9.71±2.18 | 22.43±4.53 |
| Dangfei-M | 8 | 1.01±0.29 | 5.47±0.65 | 0.57±0.10 | 0.70±0.10 | 9.24±1.81 | 22.34±4.19 |
| Dangfei-H | 8 | 0.55±0.19b | 3.93±1.07b | 0.81±0.13b | 0.41±0.10b | 4.81±0.21bc | 13.21±0.89bc |
| Essentiale | 8 | 0.56±0.13b | 3.41±0.81b | 0.78±0.11b | 0.42±0.09b | 6.42±1.88b | 16.41±3.29b |
Table 3 Changes in the levels of inflammatory factors in rats of each group (pg/mL, $\bar{x} \pm s$)
| Group | n | IL-6 | TNF-α |
|---|---|---|---|
| Normal | 8 | 0.94±0.80 | 2.40±0.96 |
| Model | 8 | 7.88±3.07a | 6.63±0.91a |
| Dangfei-L | 8 | 7.55±3.17 | 6.45±0.97 |
| Dangfei-M | 8 | 7.66±1.19 | 5.98±1.04 |
| Dangfei-H | 8 | 1.15±0.20b | 3.99±0.81b |
| Essentiale | 8 | 1.64±0.55b | 4.44±1.38b |
Table 4 Changes of serum protein level in rats of each group (g/L, $\bar{x} \pm s$)
| Group | n | TP | ALB | GLB |
|---|---|---|---|---|
| Normal | 8 | 61.4±2.7 | 33.0±2.0 | 28.4±1.2 |
| Model | 8 | 74.5±1.8a | 33.2±0.7 | 41.3±1.7a |
| Dangfei-L | 8 | 73.3±1.6 | 33.2±0.9 | 39.9±1.9 |
| Dangfei-M | 8 | 73.7±0.9 | 33.4±0.8 | 40.3±1.3 |
| Dangfei-H | 8 | 61.8±1.7bc | 33.4±0.8 | 28.6±1.8bc |
| Essentiale | 8 | 64.4±2.9b | 33.3±0.9 | 31.1±3.4b |
Table 5 Changes of serum bilirubin level in rats of each group (umol/L, $\bar{x} \pm s$)
| Group | n | TBIL | DBIL |
|---|---|---|---|
| Normal | 8 | 2.08±0.12 | 0.49±0.06 |
| Model | 8 | 6.05±0.34a | 1.51±0.07a |
| Dangfei-L | 8 | 6.01±0.31 | 1.45±0.06 |
| Dangfei-M | 8 | 5.82±0.11 | 1.51±0.06 |
| Dangfei-H | 8 | 4.00±0.21bc | 0.99±0.08b |
| Essentiale | 8 | 4.43±0.20b | 1.03±0.03b |
Table 6 Changes of inflammatory factors in liver tissue of rats in each group (pg/mL, $\bar{x} \pm s$)
| Group | n | IL-6 | TNF-α |
|---|---|---|---|
| Normal | 8 | 16.3±2.0 | 40.6±3.0 |
| Model | 8 | 30.6±3.6 | 85.4±3.4 |
| Dangfei-L | 8 | 29.3±3.0 | 84.7±5.5 |
| Dangfei-M | 8 | 28.2±3.2 | 80.8±2.9 |
| Dangfei-H | 8 | 18.8±2.4a | 52.4±2.7a |
| Essentiale | 8 | 19.6±1.5 | 52.4±2.1 |
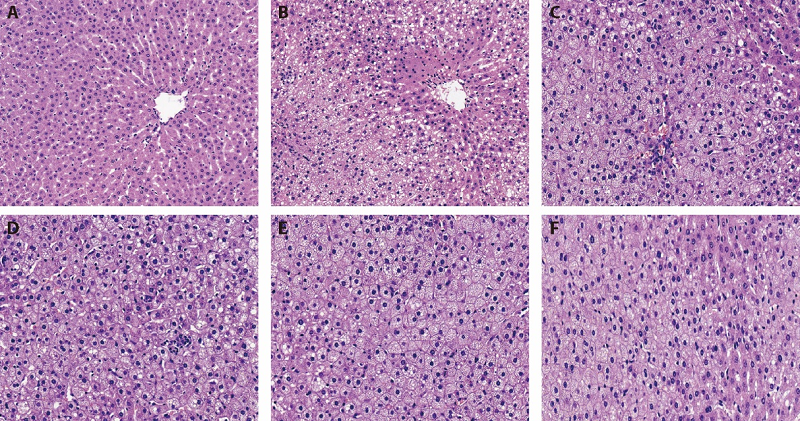
Figure 1 Pathological changes in rat livers according to treatment (hematoxylin and eosin staining, × 200) A: liver pathology of normal rat after HE staining (× 200); B: liver pathology of model rat after HE staining (× 200); C: liver pathology of Dangfei Liganning low-dose group rat after HE staining (× 200); D: liver pathology of Dangfei Liganning middle-dose group rat after after HE staining (× 200); E: liver pathology of Dangfei Liganning high-dose group rat after HE staining (× 200); F: liver pathology of Essentiale group rat after HE staining (× 200); The arrow points to fat vacuoles. The normal group and the model group were given the same amount of distilled water by gavage; Dangfei Liganning low, medium and high-dose group was given Dangfei Liganning 0.0675, 0.135 and 0.27 g•kg-1•d-1 by gavage; Essentiale group was given Essentiale 0.123 g•kg-1•d-1 by gavage.
Figure 1 Pathological changes in rat livers according to treatment (hematoxylin and eosin staining, × 200) A: liver pathology of normal rat after HE staining (× 200); B: liver pathology of model rat after HE staining (× 200); C: liver pathology of Dangfei Liganning low-dose group rat after HE staining (× 200); D: liver pathology of Dangfei Liganning middle-dose group rat after after HE staining (× 200); E: liver pathology of Dangfei Liganning high-dose group rat after HE staining (× 200); F: liver pathology of Essentiale group rat after HE staining (× 200); The arrow points to fat vacuoles. The normal group and the model group were given the same amount of distilled water by gavage; Dangfei Liganning low, medium and high-dose group was given Dangfei Liganning 0.0675, 0.135 and 0.27 g•kg-1•d-1 by gavage; Essentiale group was given Essentiale 0.123 g•kg-1•d-1 by gavage.

Figure 2 Pathological changes in rat livers according to treatment (Oil red O staining, × 200) A: liver pathology of normal rat after Oil red O staining (× 200); B: liver pathology of model rat after Oil red O staining (× 200); C: liver pathology of Dangfei Liganning low-dose group rat after Oil red O staining (× 200); D: liver pathology of Dangfei Liganning middle-dose group rat after Oil red O staining (× 200); E: liver pathology of Dangfei Liganning high-dose group rat after Oil red O staining (× 200); F: liver pathology of Essentiale group rat after Oil red O staining (× 200). The normal group and the model group were given the same amount of distilled water by gavage; Dangfei Liganning low, medium and high-dose group was given Dangfei Liganning 0.0675, 0.135 and 0.27 g·kg-1·d-1 by gavage; Essentiale group was given Essentiale 0.123 g·kg-1·d-1 by gavage.
Figure 2 Pathological changes in rat livers according to treatment (Oil red O staining, × 200) A: liver pathology of normal rat after Oil red O staining (× 200); B: liver pathology of model rat after Oil red O staining (× 200); C: liver pathology of Dangfei Liganning low-dose group rat after Oil red O staining (× 200); D: liver pathology of Dangfei Liganning middle-dose group rat after Oil red O staining (× 200); E: liver pathology of Dangfei Liganning high-dose group rat after Oil red O staining (× 200); F: liver pathology of Essentiale group rat after Oil red O staining (× 200). The normal group and the model group were given the same amount of distilled water by gavage; Dangfei Liganning low, medium and high-dose group was given Dangfei Liganning 0.0675, 0.135 and 0.27 g·kg-1·d-1 by gavage; Essentiale group was given Essentiale 0.123 g·kg-1·d-1 by gavage.
Table 7 Changes of LXR α, SREBP-1 and FAS protein in liver tissues of rats in each group detected by immunohistochemistry ($\bar{x} \pm s$)
| Group | n | LXRα | SREBP-1 | FAS |
|---|---|---|---|---|
| Normal | 8 | 345872±52737 | 259409±71143 | 201684±48205 |
| Model | 8 | 544998±55506a | 538701±62336a | 475218±78051a |
| Dangfei-H | 8 | 423402±55463b | 383871±103496b | 397673±61834b |
| Essentiale | 8 | 448588±104641b | 394167±158047b | 417853±84373b |
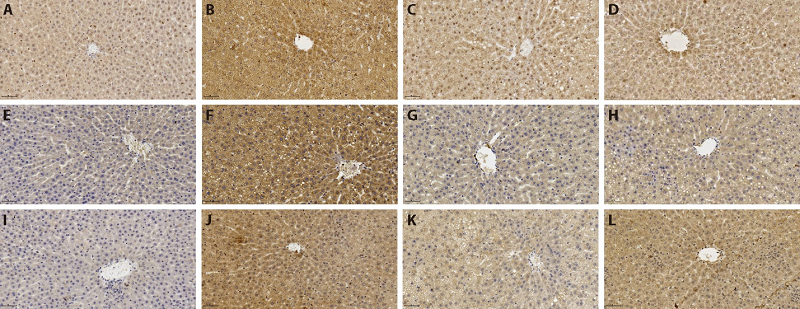
Figure 3 Expression levels of LXR α, SREBP-1 and FAS protein in each group (×400) A: normal group LXR α; B: model group LXR α; C: Dangfei Liganning high-dose group LXR α; D: Essentiale group LXR α; E: normal group SREBP-1; F: model group SREBP-1; G: Dangfei Liganning high-dose group SREBP-1; H: Essentiale group SREBP-1; I: normal group FAS; J: model group FAS; K: Dangfei Liganning high-dose group FAS; L: Essentiale group FAS. The normal group and the model group were given the same amount of distilled water by gavage; Dangfei Liganning low, medium and high-dose group was given Dangfei Liganning 0.0675, 0.135 and 0.27 g·kg-1·d-1 by gavage; Essentiale group was given Essentiale 0.123 g·kg-1·d-1 by gavage. LXR α: liver X receptor α; SREBP-1: steroid regulatory element binding protein-1; FAS: fatty acid synthase.
Figure 3 Expression levels of LXR α, SREBP-1 and FAS protein in each group (×400) A: normal group LXR α; B: model group LXR α; C: Dangfei Liganning high-dose group LXR α; D: Essentiale group LXR α; E: normal group SREBP-1; F: model group SREBP-1; G: Dangfei Liganning high-dose group SREBP-1; H: Essentiale group SREBP-1; I: normal group FAS; J: model group FAS; K: Dangfei Liganning high-dose group FAS; L: Essentiale group FAS. The normal group and the model group were given the same amount of distilled water by gavage; Dangfei Liganning low, medium and high-dose group was given Dangfei Liganning 0.0675, 0.135 and 0.27 g·kg-1·d-1 by gavage; Essentiale group was given Essentiale 0.123 g·kg-1·d-1 by gavage. LXR α: liver X receptor α; SREBP-1: steroid regulatory element binding protein-1; FAS: fatty acid synthase.
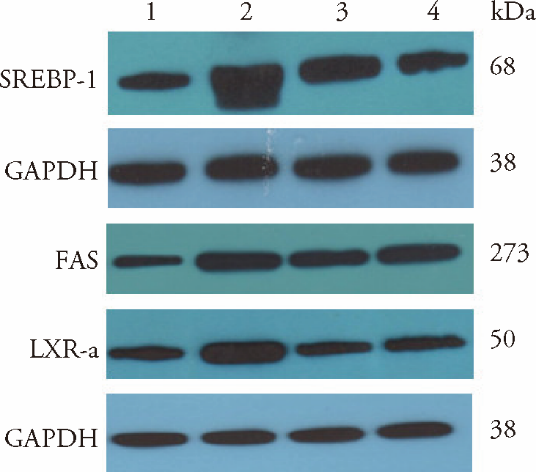
Figure 4 Expression levels of LXRα, SREBP-1, FAS protein in each group 1: normal group; 2: model group; 3: Dangfei Liganning high-dose group; 4: essentiale group. The normal group and the model group were given the same amount of distilled water by gavage; Dangfei Liganning high-dose group was given Dangfei Liganning 0.27 g·kg-1·d-1 by gavage; Essentiale group was given Essentiale 0.123 g·kg-1·d-1 by gavage. LXR α: liver X receptor α; SREBP-1: steroid regulatory element binding protein-1; FAS: fatty acid synthase; GAPDH: glyceraldehyde-3-phosphate dehy-drogenase.
Figure 4 Expression levels of LXRα, SREBP-1, FAS protein in each group 1: normal group; 2: model group; 3: Dangfei Liganning high-dose group; 4: essentiale group. The normal group and the model group were given the same amount of distilled water by gavage; Dangfei Liganning high-dose group was given Dangfei Liganning 0.27 g·kg-1·d-1 by gavage; Essentiale group was given Essentiale 0.123 g·kg-1·d-1 by gavage. LXR α: liver X receptor α; SREBP-1: steroid regulatory element binding protein-1; FAS: fatty acid synthase; GAPDH: glyceraldehyde-3-phosphate dehy-drogenase.
Table 8 Changes of LXR α, SREBP-1 and FAS protein in liver tissues of rats in each group detected by Western Blot (pg/mL, $\bar{x} \pm s$)
| Group | n | LXRα | SREBP-1 | FAS |
|---|---|---|---|---|
| Normal | 8 | 0.79±0.28 | 0.42±0.11 | 0.43±0.12 |
| Model | 8 | 1.51±0.19a | 1.14±0.45a | 1.10±0.40a |
| Dangfei-H | 8 | 0.99±0.21b | 0.82±0.18b | 0.76±0.22b |
| Essentiale | 8 | 1.09±0.35b | 0.83±0.20b | 0.79±0.27b |
Table 9 Changes of LXR α, SREBP-1 and FAS mRNA in liver tissues of rats in each group ($\bar{x} \pm s$)
| Group | n | LXRα | SREBP-1 | FAS |
|---|---|---|---|---|
| Normal | 8 | 1.14±0.41 | 1.52±0.51 | 1.42±0.49 |
| Model | 8 | 4.29±0.52a | 6.13±1.17a | 4.35±1.97a |
| Dangfei-H | 8 | 2.27±0.21b | 3.32±1.52b | 2.30±0.88b |
| Essentiale | 8 | 2.25±0.34b | 2.64±1.97b | 2.61±1.81b |
| [1] | Gao X. New thoughts about renaming nonalcoholic fatty liver disease. Lin Chuang Gan Gan Bing Za Zhi 2020; 36: 1201-4. |
| [2] | Wu J, Peng YZ. Efficacy of Dangfei Liganning capsule in nonalcoholic fatty liver disease. Shi Yong Lin Chuang Yi Xue 2018; 19: 4-6. |
| [3] | Hong HW, Zhao XW, Zhang SM, et al. Clinical observation on Dangfei Liganning Capsule combined with Chinese herbal tea in treating 37 cases of non-alcoholic fatty liver with liver constraint and spleen deficiency and damp-heat accumulation syndrome. J Tradit Chin Med 2018; 59: 227-30. |
| [4] | Alba B, Esther GJ, Jose AP et al. Molecular pathways in nonalcoholic fatty liver disease. Clin Exp Gastroenterol 2014; 7: 221-239. |
| [5] |
Liu Y, Qiu de K, Ma X. Liver X receptors bridge hepatic lipid metabolism and inflammation. J Dig Dis 2012; 13: 69-74.
DOI URL |
| [6] |
Chen G, Liang G, Ou J, et al. Central role for liver X receptor in insulinmediated activation of Srebp-1c transcription and stimulation of fatty acid synthesis in liver. Proc Natl Acad Sci USA 2004; 101: 11245-50.
DOI URL |
| [7] |
Victoria J, Yongyong H, Miwon A, et al. Impact of silencing hepatic SREBP-1 on insulin signaling. PLoS One 2018; 13: e0196704.
DOI URL |
| [8] | Chen LR, Zhang LP, Liu Y, et al. Effects of Chaiqi Tang on expression of SREBP-1c in rats with nonalcoholic fatty liver disease. Xi Bu Zhong Yi Yao 2016; 29: 13-7. |
| [9] |
Christian VL, Stefanie L, Frank NR, et al. The human longevity gene homolog INDY and interleukin-6 interact in hepatic lipid metabolism. Hepatology 2017, 66: 616-30.
DOI PMID |
| [10] |
Nati M, Haddad D, Birkenfeld A L, et al. The role of immune cells in metabolism-related liver inflammation and development of non-alcoholic steatohepatitis (NASH). Rev Endocr Metab Dis 2016; 17: 29-39.
DOI URL |
| [11] | Zhang LP. Efficacy and safety of Tiopronin sodium combined with Shenxiong glucose injection in the treatment of fatty liver. Lin Chuang He Li Yong Yao Za Zhi 2021; 14: 67-9. |
| [12] | Tang WJ, Yao YF, Yin JJ, et al. Effect of Huganqingzhi tablet on protein synthesis and bile metabolism in liver of Steatosis rats. Chinese Materia Medica 2014; 37: 1452-4. |
| [13] |
Mitro N, Mak PA, Vargas L, et al. The nuclear receptor LXR is a glucose sensor. Nature 2007; 445: 219-23.
DOI URL |
| [14] |
Yan CX, Zhang YR, Zhang XX, et al. Curcumin regulates endogenous and exogenous metabolism via Nrf2-FXR-LXR pathway in NAFLD mice. Biomed. Pharmacother 2018; 105: 274-81.
DOI URL |
| [15] |
Pan YX, Zhuo MQ, Li DD, et al. SREBP-1 and LXRα pathways mediated Cu-induced hepatic lipid metabolism in zebrafish Danio rerio. Chemosphere 2019; 215: 370-9.
DOI URL |
| [16] |
Yvan G, Nicolas D, Vanessa B, et al. Regulation of SREBP-1 expression and transcriptional action on HKII and FAS genes during fasting and refeeding in rat tissues. J Lipid Res 2005; 46: 697-705.
DOI PMID |
| [17] |
Young AM. The SCAP/SREBP pathway: a mediator of hepatic steatosis. Endocrinol Metab 2017; 32: 6-10.
DOI URL |
| [18] |
Shi L J, Shi L, Song GY, et al. Oxymatrine attenuates hepatic steatosis in non-alcoholic fatty liver disease rats fed with high fructose diet through inhibition of sterol regulatory element binding transcription factor 1 (Srebf1) and activation of peroxisome proliferator activated receptor alpha (Pparα). Eur J Pharmacol 2013; 714: 89-95.
DOI URL |
| [19] |
Yang ZX, Shen W, Sun H. Effects of nuclear receptor FXR on the regulation of liver lipid metabolism in patients with non-alcoholic fatty liver disease. Hepatol Int 2010; 4: 741-8.
DOI URL |
| [20] | Chen LR. Clinical retrospective study of youth non-alcoholic fatty liver disease and study of the mechanism of Chaiqi decoction on fatty liver in rats. Beijing: Beijing University of Chinese Medicine, 2017: 62-121. |
| Viewed | ||||||
|
Full text |
|
|||||
|
Abstract |
|
|||||