Journal of Traditional Chinese Medicine ›› 2026, Vol. 46 ›› Issue (3): 652-665.DOI: 10.19852/j.cnki.jtcm.20260206.001
• Original Articles • Previous Articles Next Articles
A multicenter randomized controlled trial and metabolomics exploration of Traditional Chinese Medicine pattern-based therapy for stable chronic obstructive pulmonary disease
DING Huanzhang1,2, WANG Hui3,4, YANG Qinjun3,4, MA Xiao3,4, WU Di1,4, LI Qiao5, ZHENG Caixia6, LU Jiasheng7, WU Chengming8, HUANG Pingfu9, CHEN Zhixiang10, WANG Shihan11, FENG Jihong12, LIU Jian12, SUN Dengdi13, ZHU Jie3,4, TONG Jiabing1,4, GAO Yating1,4, LI Zegeng1,4( )
)
- 1
Department of Respiratory Medicine ,The First Affiliated Hospital of Anhui University of Chinese Medicine Hefei 230000, China
2Fuyang Medical School ,Fuyang Normal University Fuyang 236037, China
3College of Traditional Chinese Medicine ,Anhui University of Chinese Medicine Hefei 230000, China
4Anhui Provincial Key Laboratory for the Application and Transformation of Traditional Chinese Medicine in the Prevention and Treatment of Major Respiratory Diseases Hefei 230000, China
5Department of Respiratory Medicine ,Jieshou Hospital of Traditional Chinese Medicine Jieshou 236500, China
6Department of Respiratory Medicine ,Huaibei Hospital of Traditional Chinese Medicine Huaibei 235000, China
7Department of Respiratory Medicine ,Taihe Hospital of Traditional Chinese Medicine Taihe 236600, China
8Department of Respiratory Medicine ,Bozhou Hospital of Traditional Chinese Medicine Bozhou 236000, China
9Department of Respiratory Medicine ,Chuzhou Integrated Traditional Chinese and Western Medicine Hospital Chuzhou 239000, China
10Department of Respiratory Medicine ,Wuhu Hospital of Traditional Chinese Medicine Wuhu 241000, China
11Department of Respiratory Medicine ,Lu'an Hospital of Traditional Chinese Medicine Lu'an 237000, China
12Department of Respiratory Medicine ,Second Affiliated Hospital of Tianjin University of Chinese Medicine Tianjin 300250, China
13School of Computer Science and Technology ,Anhui University Hefei 230601, China
-
Received:2025-04-14Accepted:2025-08-11Online:2026-06-15Published:2026-02-06 -
Contact:Prof. LI Zegeng, Department of Respiratory Medicine, the First Affiliated Hospital of Anhui University of Chinese Medicine, Hefei 230000, China; Anhui Provincial Key Laboratory for the Application and Transformation of Traditional Chinese Medicine in the Prevention and Treatment of Major Respiratory Diseases, Hefei 230000, China. ahzyfb@sina.com, Telephone: +86-13805516609 -
About author:First author contact:DING Huanzhang and WANG Hui are co-first authors and contributed equally to this work
-
Supported by:National Natural Science Foundation of China-funded Project: Discussion of Molecular Mechanisms of Xin'an Guben Peiyuan Method Based on Inflammation Immune Network Regulation to Improve Chronic Obstructive Pulmonary Disease Patient Perception Through Formula Syndrome Correspondence(U20A20398);Natural Science Foundation of Anhui Province-funded Project: Experimental Study on Regulation of Immune Function in Chronic Obstructive Pulmonary Disease Rats with Phlegm Stasis Obstructing Lung Syndrome by Yiqi Huatan Quyu Formula Through Lung Gut Microbiota Imbalance(2208085QH264)
Cite this article
DING Huanzhang, WANG Hui, YANG Qinjun, MA Xiao, WU Di, LI Qiao, ZHENG Caixia, LU Jiasheng, WU Chengming, HUANG Pingfu, CHEN Zhixiang, WANG Shihan, FENG Jihong, LIU Jian, SUN Dengdi, ZHU Jie, TONG Jiabing, GAO Yating, LI Zegeng. A multicenter randomized controlled trial and metabolomics exploration of Traditional Chinese Medicine pattern-based therapy for stable chronic obstructive pulmonary disease[J]. Journal of Traditional Chinese Medicine, 2026, 46(3): 652-665.
share this article
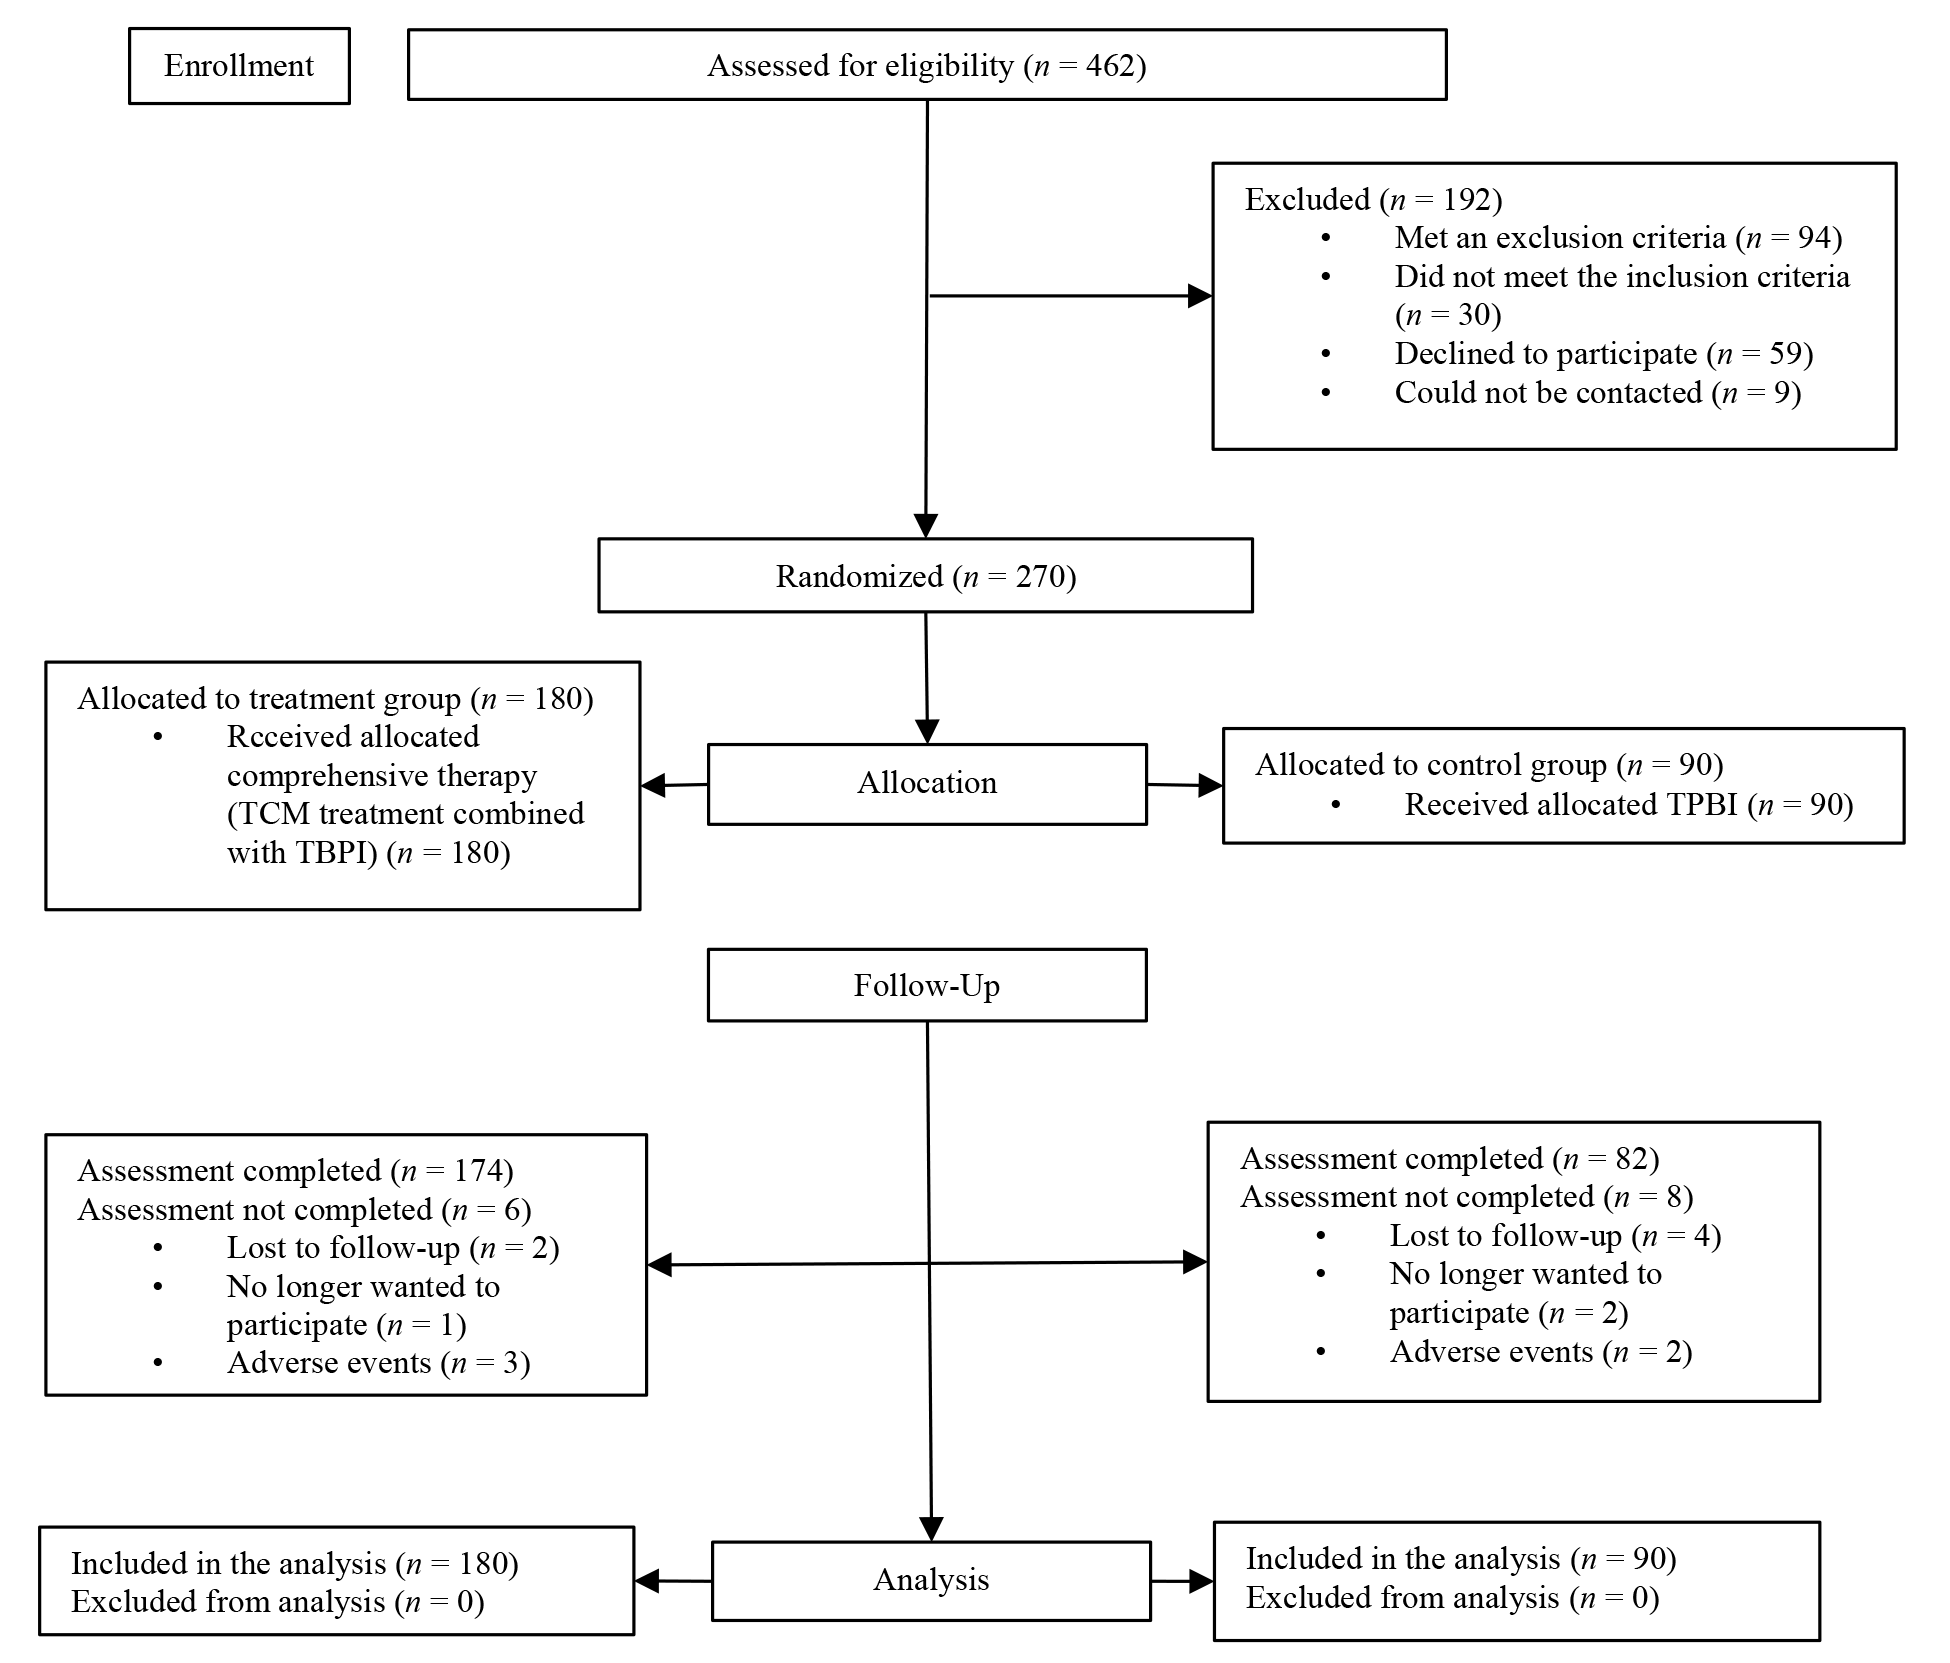
Figure 1 Study participant flow diagram Trial group: received TBPI 18 μg once daily plus TCM compound granules tailored to TCM patterns (SQWF 16 g/pack for LQD, SQBZ 18 g/pack for LSQD, SQTS 19 g/pack for LKQD; 1 pack twice daily, 24-week course); Control group: received TBPI 18 μg once daily for 24 weeks. TCM: Traditional Chinese Medicine; TBPI: tiotropium bromide powder for inhalation; SQWF: Shenqi Wenfei formula; SQBZ: Shenqi Buzhong formula; SQTS: Shenqi Tiaoshen formula; LQD: lung Qi deficiency; LSQD: lung-spleen Qi deficiency; LKQD: lung-kidney Qi deficiency.
Figure 1 Study participant flow diagram Trial group: received TBPI 18 μg once daily plus TCM compound granules tailored to TCM patterns (SQWF 16 g/pack for LQD, SQBZ 18 g/pack for LSQD, SQTS 19 g/pack for LKQD; 1 pack twice daily, 24-week course); Control group: received TBPI 18 μg once daily for 24 weeks. TCM: Traditional Chinese Medicine; TBPI: tiotropium bromide powder for inhalation; SQWF: Shenqi Wenfei formula; SQBZ: Shenqi Buzhong formula; SQTS: Shenqi Tiaoshen formula; LQD: lung Qi deficiency; LSQD: lung-spleen Qi deficiency; LKQD: lung-kidney Qi deficiency.
Table 1 Characteristics and clinical indicators of the patients
| Characteristic | Intent-to-treat analysis set | Per-protocol analysis set | |||||
|---|---|---|---|---|---|---|---|
| Trial group (n = 180) | Control group (n = 90) | P value | Trial group (n = 174) | Control group (n = 82) | P value | ||
| Age (years, | 68.0±6.1 | 67.1±6.8 | 0.361 | 68.0±6.1 | 66.7±6.8 | 0.185 | |
| Male [n (%)] | 143 (79.4) | 78 (86.7) | 0.147 | 138 (79.3) | 72 (87.8) | 0.099 | |
| BMI ( | 23.0±3.9 | 23.7±3.4 | 0.132 | 22.9±3.9 | 23.6±3.5 | 0.163 | |
| Smoking history [n (%)] | 0.839 | 0.999 | |||||
| Never smoking | 51 (28.3) | 26 (28.9) | 40 (23.0) | 19 (23.2) | |||
| Current smoking | 41 (22.8) | 23 (25.6) | 85 (48.9) | 40 (48.8) | |||
| Former smoking | 88 (48.9) | 41 (45.6) | 49 (28.2) | 23 (28.0) | |||
| Gold stage [n (%)] | 0.209 | 0.178 | |||||
| GOLD 1 | 15 (8.3) | 3 (3.3) | 15 (8.6) | 3 (3.7) | |||
| GOLD 2 | 63 (35.0) | 36 (40.0) | 60 (34.5) | 33 (40.2) | |||
| GOLD 3 | 75 (41.7) | 32 (35.6) | 73 (42.0) | 28 (34.1) | |||
| GOLD 4 | 27 (15.0) | 19 (21.1) | 26 (14.9) | 18 (22.0) | |||
| Medication use [n (%)] | 0.907 | 0.911 | |||||
| None | 68 (37.8) | 34 (37.8) | 64 (36.8) | 34 (41.5) | |||
| ICS/LABA | 42 (23.3) | 24 (26.7) | 42 (24.1) | 19 (23.2) | |||
| LAMA | 42 (23.3) | 17 (18.9) | 40 (23.0) | 15 (18.3) | |||
| LABA+LAMA | 13 (7.2) | 6 (6.7) | 13 (7.5) | 6 (7.3) | |||
| ICS/LABA+LAMA | 15 (8.3) | 9 (10.0) | 15 (8.6) | 8 (9.8) | |||
| Exacerbations, previous 52 weeks [median (IQR)] | 1 (0.25, 2) | 1 (0, 2) | 0.310 | 1 (0, 2) | 1 (0, 2) | 0.323 | |
| Exacerbations, previous 52 weeks [n (%)] | 0.647 | 0.624 | |||||
| 0 acute exacerbation | 45 (25.0) | 28 (31.1) | 45 (25.9) | 27 (32.9) | |||
| 1 acute exacerbation | 67 (37.2) | 32 (35.6) | 64 (36.8) | 28 (34.1) | |||
| 2 acute exacerbation | 44 (24.4) | 19 (21.1) | 42 (24.1) | 16 (19.5) | |||
| 3 acute exacerbation | 15 (8.3) | 9 (10.0) | 15 (8.6) | 9 (11.0) | |||
| >3 acute exacerbation | 9 (5.0) | 2 (2.2) | 8 (4.6) | 2 (2.4) | |||
| 6MWT in metres ( | 397.0±95.2 | 399.1±100.1 | 0.866 | 398.2±92.2 | 399.8±101.5 | 0.900 | |
| CAT scores ( | 20.0±7.0 | 19.9±7.1 | 0.978 | 19.8±7.1 | 19.9±7.2 | 0.945 | |
| mMRC scores [median (IQR)] | 2 (1, 3) | 2 (1, 3) | 0.520 | 2 (1, 3) | 2 (1, 3) | 0.581 | |
| Lung function | |||||||
| FEV1 (L, | 1.2±0.5 | 1.3±0.5 | 0.583 | 1.2±0.5 | 1.3±0.5 | 0.515 | |
| FEV1%pred ( | 48.5±19.2 | 46.0±18.3 | 0.353 | 48.7±19.4 | 46.1±18.4 | 0.359 | |
| FVC (L, | 2.2±0.8 | 2.3±0.7 | 0.355 | 2.3±0.8 | 2.3±0.7 | 0.360 | |
| FEV1/FVC% (%, | 53.6±9.5 | 53.2±9.8 | 0.746 | 53.5±9.5 | 53.4±10.1 | 0.941 | |
Table 2 Comparison of COPD exacerbation frequency
| Item | Intent-to-treat analysis set | Per-protocol analysis set | |||||||
|---|---|---|---|---|---|---|---|---|---|
| Trial group (n = 180) | Control group (n = 90) | χ 2/Z value | P value | Trial group (n = 174) | Control group (n = 82) | χ 2/Z value | P value | ||
| Number of exacerbation events [n (%)] | 11.518 | 0.021 | 13.898 | 0.008 | |||||
| 0 acute exacerbation | 97 (53.9) | 37 (41.1) | 97 (55.7) | 36 (43.9) | |||||
| 1 acute exacerbation | 37 (20.6) | 26 (28.9) | 34 (19.5) | 22 (26.8) | |||||
| 2 acute exacerbation | 33 (18.3) | 11 (12.2) | 31 (17.8) | 8 (9.8) | |||||
| 3 acute exacerbation | 9 (5) | 10 (11.1) | 9 (5.2) | 10 (12.2) | |||||
| >3 acute exacerbation | 4 (2.2) | 6 (6.7) | 3 (1.7) | 6 (7.3) | |||||
| Number of exacerbation events [median (IQR)] | 0 (0, 2) | 1 (0, 2) | -2.036 | 0.042 | 0 (0, 1.25) | 1 (0, 2) | -1.961 | 0.049 | |
Table 3 Secondary outcomes: CAT, mMRC and 6MWT
| Item | Intent-to-treat analysis set | Per-protocol analysis set | ||||||
|---|---|---|---|---|---|---|---|---|
| 0 Week | 24 Week | 52 Week | 0 Week | 24 Week | 52 Week | |||
| CAT ( | Trial group | 20±7 | 16±6 | 17±7 | 20±7 | 16±6 | 17±7 | |
| Control group | 20±7 | 18±7 | 18±7 | 20±7 | 18±7 | 18±7 | ||
| Estimate (95% CI) | 0.000 (-2.000, 2.000) | -1.799 (-3.120, -0.479) | -1.366 (-2.748, 0.016) | 0.000 (-2.000, 2.000) | -1.622 (-3.023, -0.221) | -1.200 (-2.663, 0.263) | ||
| χ 2/Z value | -0.027 | 7.130 | 3.753 | -0.069 | 5.147 | 2.586 | ||
| P value | 0.978 | 0.008 | 0.053 | 0.945 | 0.023 | 0.108 | ||
| mMRC [median (IQR)] | Trial group | 2 (1, 3) | 2 (1, 2) | 2 (1, 2) | 2 (1, 3) | 2 (1, 2) | 2 (1, 2) | |
| Control group | 2 (1, 3) | 2 (1, 3) | 2 (1, 3) | 2 (1, 3) | 2 (1, 3) | 2 (1, 3) | ||
| Estimate (95% CI) | 0.000 (0.000, 0.000) | -0.581 (-1.059, -0.102) | -0.712 (-1.258, -0.166) | 0.000 (0.000, 0.000) | -0.584 (-1.097, -0.070) | -0.745 (-1.319, -0.171) | ||
| χ 2/Z value | -0.644 | 5.657 | 6.541 | -0.551 | 4.967 | 6.478 | ||
| P value | 0.520 | 0.017 | 0.011 | 0.581 | 0.026 | 0.011 | ||
| 6MWT ( | Trial group | 397±95 | 417±90 | 407±95 | 398±92 | 419±88 | 408±93 | |
| Control group | 399±100 | 392±100 | 383±105 | 400±102 | 392±102 | 383±107 | ||
| Estimate (95% CI) | -2.111 (-26.733, 22.511) | 27.105 (16.924, 37.285) | 25.598 (14.891, 36.305) | -1.599 (-26.724, 23.525) | 27.483 (16.630, 38.335) | 26.323 (14.946, 37.701) | ||
| χ 2/Z value | -0.169 | 27.230 | 21.958 | -0.125 | 24.636 | 20.563 | ||
| P value | 0.866 | 0.000 | 0.000 | 0.900 | 0.000 | 0.000 | ||
Table 4 Secondary outcomes: FEV1, FEV1%pred, FVC and FEV1/FVC
| Item | Intent-to-treat analysis set | Per-protocol analysis set | ||||||
|---|---|---|---|---|---|---|---|---|
| 0 Week | 24 Week | 52 Week | 0 Week | 24 Week | 52 Week | |||
| FEV1 (L, | Trial group | 1.2±0.5 | 1.2±0.6 | 1.2±0.5 | 1.2±0.5 | 1.2±0.6 | 1.2±0.5 | |
| Control group | 1.3±0.5 | 1.3±0.5 | 1.2±0.5 | 1.3±0.5 | 1.3±0.5 | 1.2±0.5 | ||
| Estimate (95% CI) | -0.031 (-0.167, 0.090) | 0.006 (-0.056, 0.067) | 0.008 (-0.054, 0.070) | -0.040 (-0.184, 0.092) | -0.006 (-0.067, 0.055) | -0.000 (-0.063, 0.063) | ||
| χ 2/Z value | -0.549 | 0.032 | 0.067 | -0.650 | 0.037 | 0.000 | ||
| P value | 0.583 | 0.858 | 0.795 | 0.515 | 0.848 | 0.995 | ||
| FEV1%pred (%, | Trial group | 48.5±19.3 | 48.5±20.3 | 47.3±19.7 | 48.7±19.4 | 48.8±20.4 | 47.6±19.8 | |
| Control group | 46.0±18.3 | 46.0±16.4 | 44.438±17.5 | 46.1±18.4 | 46.6±16.6 | 44.8±17.8 | ||
| Estimate (95% CI) | 2.021 (-2.501, 7.010) | 0.473 (-2.040, 2.986) | 0.932 (-1.400, 3.264) | 2.681 (-2.810, 7.730) | 0.152 (-2.443, 2.747) | 0.727 (-1.666, 3.120) | ||
| χ 2/Z value | -0.928 | 0.136 | 0.613 | -0.916 | 0.013 | 0.355 | ||
| P value | 0.353 | 0.712 | 0.434 | 0.359 | 0.909 | 0.551 | ||
| FVC (L, | Trial group | 2.2±0.8 | 2.2±0.8 | 2.2±0.7 | 2.3±0.8 | 2.3±0.8 | 2.3±0.7 | |
| Control group | 2.3±0.7 | 2.3±0.7 | 2.3±0.7 | 2.3±0.7 | 2.4±0.7 | 2.3±0.7 | ||
| Estimate (95% CI) | -0.090 (-0.291, 0.105) | -0.033 (-0.126, 0.059) | -0.004 (-0.085, 0.077) | -0.091 (-0.301, 0.118) | -0.047 (-0.144, 0.049) | -0.016 (-0.099, 0.068) | ||
| χ 2/Z value | -0.924 | 0.5 | 0.01 | -0.914 | 0.939 | 0.137 | ||
| P value | 0.355 | 0.479 | 0.920 | 0.360 | 0.332 | 0.712 | ||
| FEV1/FVC (%, | Trial group | 53.6±9.5 | 54.2±10.0 | 51.8±11.1 | 53.5±9.5 | 54.0±10.0 | 51.5±11.2 | |
| Control group | 53.2±9.8 | 53.2±9.9 | 51.4±10.6 | 53.4±10.1 | 53.4±10.0 | 51.5±10.8 | ||
| Estimate (95% CI) | 0.402 (-2.036, 2.839) | 0.867 (-0.735, 2.469) | 0.205 (-1.413, 1.823) | 0.096 (-2.457, 2.649) | 0.775 (-0.913, 2.463) | 0.201 (-1.501, 1.904) | ||
| χ 2/Z value | 0.324 | 1.124 | 0.062 | 0.074 | 0.809 | 0.054 | ||
| P value | 0.746 | 0.289 | 0.804 | 0.941 | 0.368 | 0.817 | ||
Table 5 Comparison of adverse events (SS set, n)
| Type of adverse event | Trial group | Control group |
|---|---|---|
| Nausea | 1 | 0 |
| Bloating | 7 | 2 |
| Diarrhea | 3 | 1 |
| Urticaria | 1 | 0 |
| Joint pain | 3 | 2 |
| Palpitation | 0 | 1 |
| Acute myocardial infarction | 0 | 1 |
| Deep venous thrombosis | 1 | 0 |
| Periodontitis | 2 | 1 |
| Cervical spondylopathy | 1 | 1 |
| Urinary tract infection | 2 | 2 |
| Gallstone | 0 | 1 |
| Lung cancer | 1 | 0 |
| Solitary pulmonary nodule | 2 | 2 |
| Mouth ulcers | 0 | 1 |
| Constipation | 1 | 2 |
| Hypertension | 2 | 1 |
| Fracture | 0 | 1 |

Figure 2 Metabolomics analysis of serum samples A: PLS-DA plot showing the metabolic profile distribution of Group A (blue), Group B (orange), and Group C (green); B: PLS-DA-3D plot visualizing the 3D clustering of metabolic features among the three groups; C: heatmap of differential metabolites, with hierarchical clustering reflecting the relative abundance of metabolites in each group; D: KEGG pathway comparison between Group A and Group C, reflecting serum metabolic changes in patients; E: KEGG pathway comparison between Group B and Group A, showing metabolic changes after drug intervention. For panels D and E: blue bars indicate downregulated pathways, red bars indicate upregulated pathways. The x-axis represents the ratio of differential (foreground) to total (background) metabolites in each pathway; the y-axis lists pathway names. Group A: patients with stable COPD before TCM pattern-based comprehensive therapy; Group B: patients with stable COPD after TCM pattern-based comprehensive therapy (TBPI 18 μg once daily + TCM granules tailored to TCM patterns: SQWF 16 g/pack for LQD, SQBZ 18 g/pack for LSQD, SQTS 19 g/pack for LKQD; 1 pack twice daily, 24-week course); Group C: healthy controls without intervention. PLS-DA: partial least squares discriminant analysis; OPLS-DA: orthogonal partial least squares discriminant analysis; KEGG: kyoto encyclopedia of genes and genomes; COPD: chronic obstructive pulmonary disease; TCM: traditional chinese medicine; TBPI: tiotropium bromide powder for inhalation; SQWF: Shenqi Wenfei formula; SQBZ: Shenqi Buzhong formula; SQTS: Shenqi Tiaoshen formula; LQD: lung Qi deficiency; LSQD: lung-spleen Qi deficiency; LKQD: lung-kidney Qi deficiency; VIP: variable importance in projection; ANOVA: analysis of variance. PLS-DA and OPLS-DA models distinguished group metabolic profiles. Differential metabolites were identified by two-tailed Student's t-test (P < 0.05) and VIP > 1. Multi-group comparisons used one-way ANOVA, with hierarchical clustering for heatmap visualization.
Figure 2 Metabolomics analysis of serum samples A: PLS-DA plot showing the metabolic profile distribution of Group A (blue), Group B (orange), and Group C (green); B: PLS-DA-3D plot visualizing the 3D clustering of metabolic features among the three groups; C: heatmap of differential metabolites, with hierarchical clustering reflecting the relative abundance of metabolites in each group; D: KEGG pathway comparison between Group A and Group C, reflecting serum metabolic changes in patients; E: KEGG pathway comparison between Group B and Group A, showing metabolic changes after drug intervention. For panels D and E: blue bars indicate downregulated pathways, red bars indicate upregulated pathways. The x-axis represents the ratio of differential (foreground) to total (background) metabolites in each pathway; the y-axis lists pathway names. Group A: patients with stable COPD before TCM pattern-based comprehensive therapy; Group B: patients with stable COPD after TCM pattern-based comprehensive therapy (TBPI 18 μg once daily + TCM granules tailored to TCM patterns: SQWF 16 g/pack for LQD, SQBZ 18 g/pack for LSQD, SQTS 19 g/pack for LKQD; 1 pack twice daily, 24-week course); Group C: healthy controls without intervention. PLS-DA: partial least squares discriminant analysis; OPLS-DA: orthogonal partial least squares discriminant analysis; KEGG: kyoto encyclopedia of genes and genomes; COPD: chronic obstructive pulmonary disease; TCM: traditional chinese medicine; TBPI: tiotropium bromide powder for inhalation; SQWF: Shenqi Wenfei formula; SQBZ: Shenqi Buzhong formula; SQTS: Shenqi Tiaoshen formula; LQD: lung Qi deficiency; LSQD: lung-spleen Qi deficiency; LKQD: lung-kidney Qi deficiency; VIP: variable importance in projection; ANOVA: analysis of variance. PLS-DA and OPLS-DA models distinguished group metabolic profiles. Differential metabolites were identified by two-tailed Student's t-test (P < 0.05) and VIP > 1. Multi-group comparisons used one-way ANOVA, with hierarchical clustering for heatmap visualization.
| 1. |
Petousi N, Pavord ID, Couillard S. The Lancet COPD commission: broader questions remain. Lancet 2023; 401: 1569-70.
DOI PMID |
| 2. |
GBD 2021 Causes of Death Collaborators. Global burden of 288 causes of death and life expectancy decomposition in 204 countries and territories and 811 subnational locations, 1990-2021: a systematic analysis for the Global Burden of Disease Study 2021. Lancet 2024; 403: 2100-32.
DOI PMID |
| 3. |
GBD 2021 Forecasting Collaborators. Burden of disease scenarios for 204 countries and territories, 2022-2050: a forecasting analysis for the Global Burden of Disease Study 2021. Lancet 2024; 403: 2204-56.
DOI PMID |
| 4. |
Kreuter M, Cottin V. The threat in chronic lung diseases: acute exacerbations. Eur Respir Rev 2017; 26: 170075.
DOI URL |
| 5. |
Moll M, Silverman EK. Precision approaches to chronic obstructive pulmonary disease management. Annu Rev Med 2024; 75: 247-62.
DOI URL |
| 6. | Dekhuijzen PNR, Hass N, Liu J, Dreher M. Daily impact of COPD in younger and older adults: global online survey results from over 1300 patients. COPD 2020; 17: 419-28. |
| 7. |
Gruß I, McCreary GM, Ivlev I, et al. Developing a patient-driven chronic obstructive pulmonary disease (COPD) research agenda in the U.S. J Patient Rep Outcomes 2021; 5: 126.
DOI PMID |
| 8. |
George J, Kong DCM, Stewart K, Ioannides-Demos LL, Santamaria NM. Use of complementary and alternative medicines by patients with chronic obstructive pulmonary disease. Med J Aust 2004; 181: 248-51.
DOI PMID |
| 9. |
Li JS, Chen RC, Yu XQ, Liu HG. Guidelines of integrated Chinese and Western Medicine for diagnosis and treatment of chronic obstructive pulmonary disease (2022). J Evid Based Med 2023; 16: 565-80.
DOI URL |
| 10. |
Li JS, Li SY, Xie Y, et al. The effective evaluation on symptoms and quality of life of chronic obstructive pulmonary disease patients treated by comprehensive therapy based on Traditional Chinese Medicine patterns. Complement Ther Med 2013; 21: 595-602.
DOI URL |
| 11. | Wang DY, Dong CW, Li ZG, Zhang ZQ, Tong JB, Li D. Clinical study of winter disease and summer treatment acupoint application combined with Liuwei Buqi granule in the treatment of COPD stable period. Liaoning Zhong Yi Yao Da Xue Xue Bao 2019; 21: 87-90. |
| 12. | Wu D, Wang XL, Gao YT, et al. Shenqi Wenfei Formula alleviates chronic obstructive pulmonary disease in rats with pulmonary Qi deficiency syndrome by regulating NLRP3/GSDMD pyroptosis pathway. Nan Fang Yi Ke Da Xue Xue Bao 2023; 43: 1500-8. |
| 13. | Zhou FC, Yang QJ, Wu D, et al. Shenqi Tiaoshen Formula inhibits COPD mediated bone resorption through OPG/RANKL/NF-κB/MMP-9 pathway. Zhong Yao Yao Li Yu Lin Chuang 2024, 40: 54-60. |
| 14. | Wang H, Yang QJ, Zhou FC, Yang C, Tong JB, Li ZG. To investigate the effect of Shenqi Tiaoshen formula on CSE induced inflammatory response of MH-S cells based on TLR4/NF-kB/NLRP3 pathway. Hainan Yi Xue Yuan Xue Bao 2023; 29: 1295-301. |
| 15. | Global Initiative for Chronic Obstructive Lung Disease (GOLD). Global strategy for the diagnosis, management and prevention of chronic obstructive pulmonary disease, 2021 report. GOLD serial online, 2020-11-30, cited 2021-05-13; 20-36 screens. Available from URL: http://www.goldcopd.org. |
| 16. | China Association of Chinese Medicine. Guidelines for TCM Diagnosis and Treatment of Chronic Obstructive Pulmonary Disease (2019 Version) [T/CACM 1319-2019]. China Association of Chinese Medicine serial online, 2022-07-12, cited 2021-05-13; 14-17 screens. Available from URL: https://hxxtzx.hactcm.edu.cn/info/1148/2669.htm. |
| 17. | China Food and Drug Administration. Good Manufacturing Practice for Medical Products (2015 Revision). Order No. 13. National Medical Products Administration serial online, 2015-07-01, cited 2021-12-05; 1-8 screens. Available from URL: https://www.nmpa.gov.cn/yaopin/ypfgwj/ypfgbmgzh/20150701120001394.html. |
| 18. |
Anthonisen NR, Manfreda J, Warren CP, Hershfield ES, Harding GK, Nelson NA. Antibiotic therapy in exacerbations of chronic obstructive pulmonary disease. Ann Intern Med 1987; 106: 196-204.
DOI PMID |
| 19. |
Jones PW, Harding G, Berry P, Wiklund I, Chen WH, Kline Leidy N. Development and first validation of the COPD Assessment Test. Eur Respir J 2009; 34: 648-54.
DOI PMID |
| 20. |
Sunjaya A, Poulos L, Reddel H, Jenkins C. Qualitative validation of the modified Medical Research Council (mMRC) dyspnoea scale as a patient-reported measure of breathlessness severity. Respir Med 2022; 203: 106984.
DOI URL |
| 21. |
Holland AE, Spruit MA, Troosters T, et al. An official European Respiratory Society/American Thoracic Society technical standard: field walking tests in chronic respiratory disease. Eur Respir J 2014; 44: 1428-46.
DOI PMID |
| 22. | Lenferink A, Brusse-Keizer M, Van der Valk PD, et al. Self-management interventions including action plans for exacerbations versus usual care in patients with chronic obstructive pulmonary disease. Cochrane Database Syst Rev 2017; 8: CD011682. |
| 23. |
Wang MH, Li JS, Li SY, Xie Y. Effects of comprehensive therapy based on Traditional Chinese Medicine patterns on older patients with chronic obstructive pulmonary disease: a subgroup analysis from a four-center, randomized, controlled study. Front Med 2014; 8: 368-75.
DOI URL |
| 24. | Chow SC, Shao J, Wang HS, Lokhnygina Y. Sample Size Calculation in Clinical Research. 3rd ed. New York: Chapman and Hall/CRC 2017: 100-10. |
| 25. |
Cao GD, Song ZB, Hong YJ, et al. Large-scale targeted metabolomics method for metabolite profiling of human samples. Anal Chim Acta 2020; 1125: 144-51.
DOI PMID |
| 26. |
Zheng FJ, Zhao XJ, Zeng ZD, et al. Development of a plasma pseudotargeted metabolomics method based on ultra-high-performance liquid chromatography-mass spectrometry. Nat Protoc 2020; 15: 2519-37.
DOI PMID |
| 27. |
Dransfield MT, Kunisaki KM, Strand MJ, et al. Acute exacerbations and lung function loss in smokers with and without chronic obstructive pulmonary disease. Am J Respir Crit Care Med 2017; 195: 324-30.
DOI URL |
| 28. |
Jacobsen PA, Kragholm KH, Torp-Pedersen C, Janssen DJA, Spruit MA, Weinreich UM. Employment status, readmission and mortality after acute exacerbation of COPD. Int J Chron Obstruct Pulmon Dis 2021; 16: 2257-65.
DOI URL |
| 29. |
Du YP, Lin J, Wang XX, et al. Early pulmonary rehabilitation in acute exacerbation of chronic obstructive pulmonary disease: a Meta-analysis of randomized controlled trials. COPD 2022; 19: 69-80.
DOI URL |
| 30. |
Camac ER, Voelker H, Criner GJ. COPD Clinical Research Network and the Canadian Institutes of Health Research. Impact of COPD exacerbations leading to hospitalization on general and disease-specific quality of life. Respir Med 2021; 186: 106526.
DOI URL |
| 31. | Zhang YB, Chen F, Sun M, et al. Dongtian Changchun ointment for moderate-to-severe chronic obstructive pulmonary disease: a multicenter, prospective, open-label, randomized controlled trial. J Tradit Chin Med 2025; 45: 1395-404. |
| 32. |
Ma JF, Zheng JP, Zhong NS, et al. Effects of Yupingfeng granules on acute exacerbations of COPD: a randomized, placebo-controlled study. Int J Chron Obstruct Pulmon Dis 2018; 13: 3107-14.
DOI URL |
| 33. |
Chen YB, Gong X, Zhou MJ, et al. Treatment with JianPiYiFei II granules for patients with moderate to very severe chronic obstructive pulmonary disease: a 52-week randomised, double-blinded, placebo-controlled, multicentre trial. Phytomedicine 2022; 100: 154057.
DOI URL |
| 34. |
Crisan AF, Pescaru CC, Maritescu A, Stoicescu ER, Carunta V, Oancea C. The impact of chronic obstructive pulmonary disease severity on psychological and functional outcomes: a cross-sectional analysis. J Clin Med 2025; 14: 1865.
DOI URL |
| 35. |
Sundh J, Janson C, Lisspers K, Ställberg B, Montgomery S. The Dyspnoea, Obstruction, Smoking, Exacerbation (DOSE) index is predictive of mortality in COPD. Prim Care Respir J 2012; 21: 295-301.
DOI URL |
| 36. |
Nishimura K, Izumi T, Tsukino M, Oga T. Dyspnea is a better predictor of 5-year survival than airway obstruction in patients with COPD. Chest 2002; 121: 1434-40.
DOI PMID |
| 37. | Cen J, Weng L. Comparison of peak expiratory flow (PEF) and COPD assessment test (CAT) to assess COPD exacerbation requiring hospitalization: a prospective observational study. Chron Respir Dis 2022; 19: 14799731221081859. |
| 38. |
Wu JJ, Xu HR, Zhang YX, et al. The characteristics of the frequent exacerbator with chronic bronchitis phenotype and non-exacerbator phenotype in patients with chronic obstructive pulmonary disease: a Meta-analysis and system review. BMC Pulm Med 2020; 20: 103.
DOI |
| 39. |
Pinto-Plata VM, Cote C, Cabral H, Taylor J, Celli BR. The 6-min walk distance: change over time and value as a predictor of survival in severe COPD. Eur Respir J 2004; 23: 28-33.
DOI PMID |
| 40. |
Tashkin DP, Celli B, Senn S, et al. A 4-year trial of tiotropium in chronic obstructive pulmonary disease. N Engl J Med 2008; 359: 1543-54.
DOI URL |
| 41. |
Liu YB, Hong JR, Jiang N, et al. The role of mitochondrial quality control in chronic obstructive pulmonary disease. Lab Invest 2024; 104: 100307.
DOI URL |
| 42. |
Pokharel MD, Garcia-Flores A, Marciano D, et al. Mitochondrial network dynamics in pulmonary disease: bridging the gap between inflammation, oxidative stress, and bioenergetics. Redox Biol 2024; 70: 103049.
DOI URL |
| 43. |
Martínez-Reyes I, Chandel NS. Mitochondrial TCA cycle metabolites control physiology and disease. Nat Commun 2020; 11: 102.
DOI PMID |
| 44. |
Pålsson-McDermott EM, O’Neill LAJ. Targeting immunometabolism as an anti-inflammatory strategy. Cell Res 2020; 30: 300-14.
DOI PMID |
| 45. |
Finamore P, Lattanzi G, Pedone C, et al. Energy expenditure and intake in COPD: the extent of unnoticed unbalance by predicting REE. Respir Med 2022; 201: 106951.
DOI URL |
| 46. |
Naz S, Kolmert J, Yang M, et al. Metabolomics analysis identifies sex-associated metabotypes of oxidative stress and the autotaxin-lysoPA axis in COPD. Eur Respir J 2017; 49: 1602322.
DOI URL |
| 47. |
Xue MS, Zeng YF, Lin RP, et al. Metabolomic profiling of anaerobic and aerobic energy metabolic pathways in chronic obstructive pulmonary disease. Exp Biol Med (Maywood) 2021; 246: 1586-96.
DOI URL |
| 48. |
Peng L, You H, Xu MY, et al. A novel metabolic score for predicting the acute exacerbation in patients with chronic obstructive pulmonary disease. Int J Chron Obstruct Pulmon Dis 2023; 18: 785-95.
DOI URL |
| 49. |
Pinto-Plata V, Casanova C, Divo M, et al. Plasma metabolomics and clinical predictors of survival differences in COPD patients. Respir Res 2019; 20: 219.
DOI |
| Viewed | ||||||
|
Full text |
|
|||||
|
Abstract |
|
|||||