
Journal of Traditional Chinese Medicine ›› 2026, Vol. 46 ›› Issue (4): 821-831.DOI: 10.19852/j.cnki.jtcm.2026.04.005
• Original Articles • Previous Articles Next Articles
Yigongsan decoction (异功散) ameliorates anemia of chronic disease by attenuating mothers against decapentaplegic homolog-signal transducer and activator of transcription 3 interaction to regulate iron homeostasis
ZHENG Qin1, ZHU Xiaoqin2, HU Jie3, BU Jingyang1, JI Yuting1, JIANG Yiling1, SHI Ling1, ZHANG Aiping1, WU Zhihao1, XU Haitao1, ZHANG Ruifeng1, YANG Yang4( ), LUO Meihong1
- 1
Department of Hematology ,Shanghai Baoshan Hospital of Integrated Traditional Chinese and Western Medicine (Baoshan Hospital, Shanghai University of Traditional Chinese Medicine) Shanghai 201999, China
2Department of Hematology ,Shanghai Shuguang Hospital Affiliated to Shanghai University of Traditional Chinese Medicine Shanghai 200021, China
3Shanghai Huating Town Community Health Service Center Shanghai 201816, China
4Department of Science and Technology Experiment Center ,Shanghai University of Traditional Chinese Medicine Shanghai 201203, China
-
Received:2025-10-06Accepted:2026-04-17Online:2026-08-15Published:2026-08-08 -
Contact:Prof. YANG Yang, Department of Science and Technology Experiment Center, Shanghai University of Traditional Chinese Medicine, Shanghai 201203, China. yyang_shutcm@126.com;
Prof. LUO Meihong, Department of Hematology, Shanghai Baoshan Hospital of Integrated Traditional Chinese and Western Medicine, Shanghai 201999, China,Telephone: +86-13585703963 -
About author:First author contact:ZHENG Qin and ZHU Xiaoqin are co-first authors and contributed equally to this work
-
Supported by:The Shanghai Oriental Talent Youth Program: Mechanism Study of Yigongsan Decoction in Improving Anemia of Chronic Disease by Downregulating Hepcidin Antimicrobial Peptide Through Histone Modification-mediated Crosstalk of Mothers Against Decapentaplegic Homolog/Signal Transducer and Activator of Transcription 3 Signaling Pathways(QNWS2024111);National Natural Science Foundation Youth Project: Mechanism Study of Yigongsan Decoction in Improving Iron Metabolism in Anemia of Chronic Disease by Regulating the Hepcidin-ferroportin Axis Through Activin B Competitive Binding to Bone Morphogenetic Protein Receptors(81804021);Construction of Key Medical Science (Specialty) Department in Baoshan District(BSZK-2023-Z01);Shanghai Key Discipline of Traditional Chinese Medicine (Clinical Type) Project(shzyyzdxk-2024208)

Cite this article
ZHENG Qin, ZHU Xiaoqin, HU Jie, BU Jingyang, JI Yuting, JIANG Yiling, SHI Ling, ZHANG Aiping, WU Zhihao, XU Haitao, ZHANG Ruifeng, YANG Yang, LUO Meihong. Yigongsan decoction (异功散) ameliorates anemia of chronic disease by attenuating mothers against decapentaplegic homolog-signal transducer and activator of transcription 3 interaction to regulate iron homeostasis[J]. Journal of Traditional Chinese Medicine, 2026, 46(4): 821-831.
share this article

Figure 1 Effect of YGS on iron metabolism in mice A: representative Prussian blue staining images (× 200) of spleen sections in the CTL, LPS, YGS, and YGS + LPS groups; A1: CTL group; A2: LPS group; A3: YGS group; A4: YGS + LPS group; B: quantitative analysis of the percentage of iron-positive area in the spleen; C: serum iron level; D: liver HAMP mRNA relative expression; E: liver Fpn mRNA relative expression. CTL group: the same volume of water; LPS group: 1.5 mg/kg LPS on day 8; YGS group: YGS 15.413 g·kg-1·d-1; YGS + LPS group: YGS 15.413 g·kg-1·d-1 + 1.5 mg·kg-1 LPS. CTL: control; YGS: Yigongsan decoction; LPS: lipopolysaccharide; HAMP: hepcidin antimicrobial peptide; Fpn: ferroportin. Statistical analysis was performed using one-way analysis of variance followed by the least significant difference test for multiple comparisons. Data were presented as mean ± standard deviation (n = 6). Compared with the CTL group, aP < 0.05; compared with the LPS group, bP < 0.05.
Figure 1 Effect of YGS on iron metabolism in mice A: representative Prussian blue staining images (× 200) of spleen sections in the CTL, LPS, YGS, and YGS + LPS groups; A1: CTL group; A2: LPS group; A3: YGS group; A4: YGS + LPS group; B: quantitative analysis of the percentage of iron-positive area in the spleen; C: serum iron level; D: liver HAMP mRNA relative expression; E: liver Fpn mRNA relative expression. CTL group: the same volume of water; LPS group: 1.5 mg/kg LPS on day 8; YGS group: YGS 15.413 g·kg-1·d-1; YGS + LPS group: YGS 15.413 g·kg-1·d-1 + 1.5 mg·kg-1 LPS. CTL: control; YGS: Yigongsan decoction; LPS: lipopolysaccharide; HAMP: hepcidin antimicrobial peptide; Fpn: ferroportin. Statistical analysis was performed using one-way analysis of variance followed by the least significant difference test for multiple comparisons. Data were presented as mean ± standard deviation (n = 6). Compared with the CTL group, aP < 0.05; compared with the LPS group, bP < 0.05.
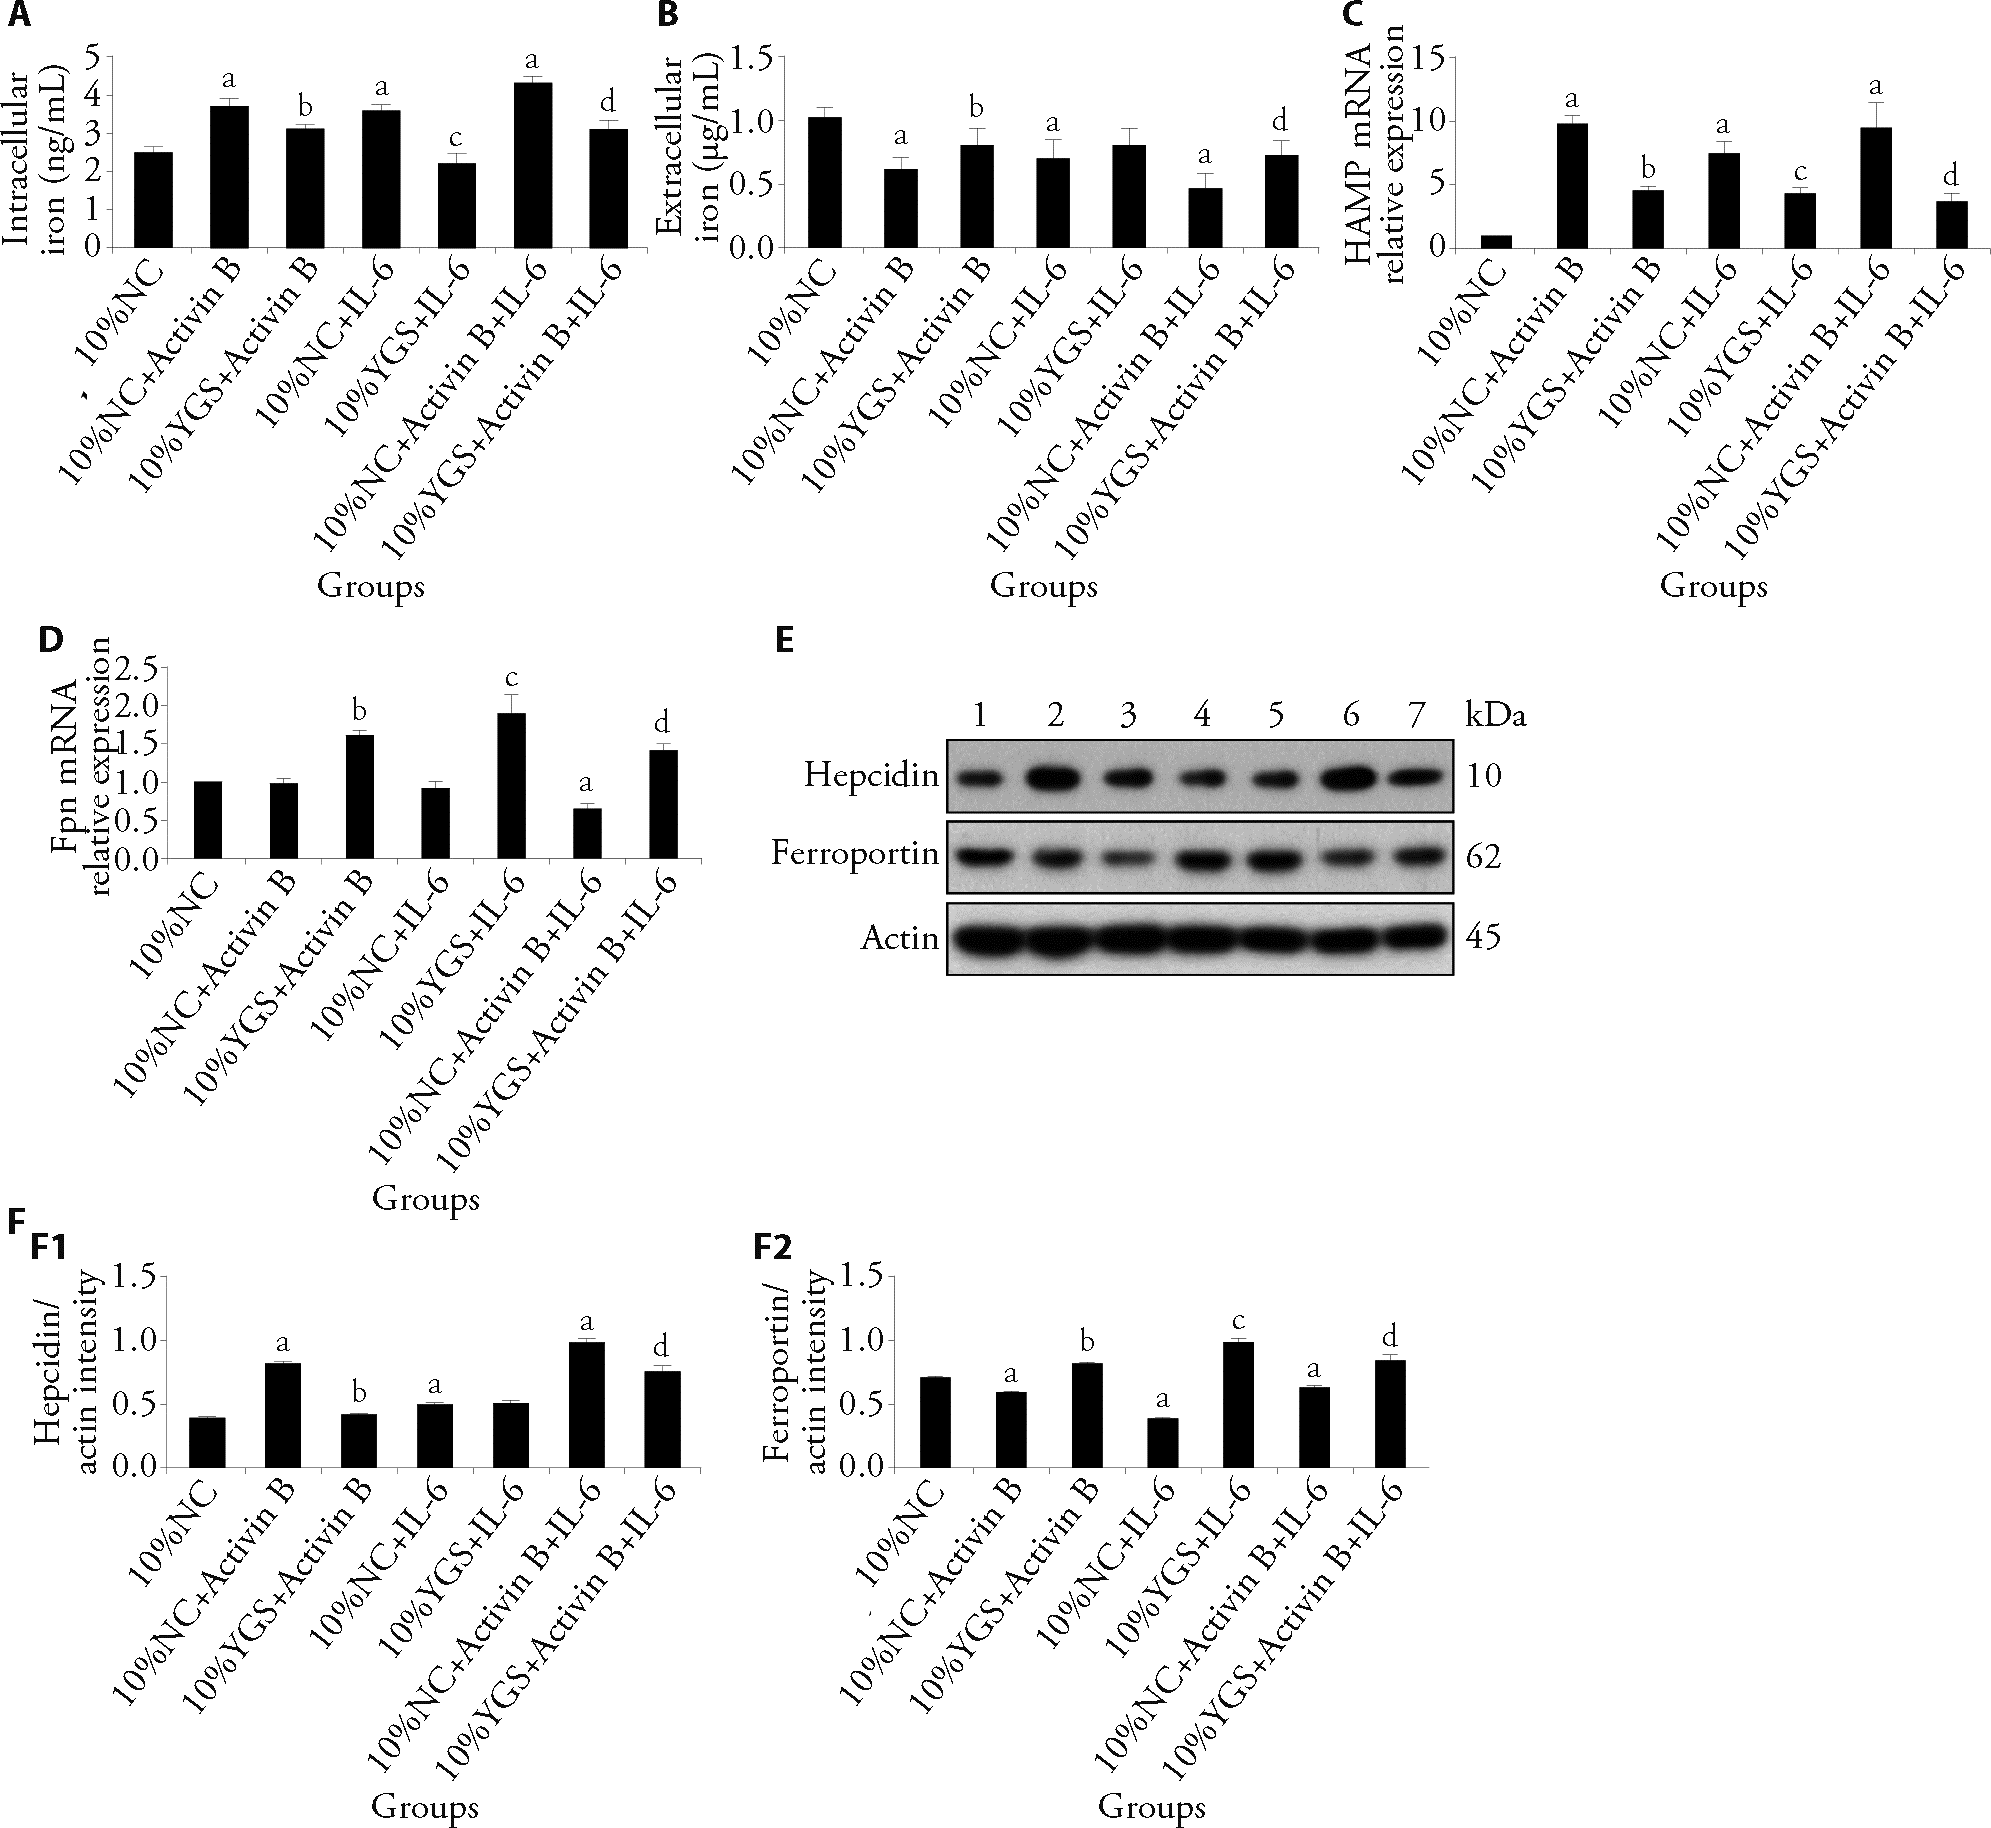
Figure 2 Effect of YGS-medicated serum on iron metabolism in vitro A: intracellular iron; B: extracellular iron; C: intracellular HAMP mRNA; D: intracellular Fpn mRNA expression; E: representative western blot of intracellular hepcidin and ferroportin; 1: 10% NC; 2: 10% NC + Activin B; 3: 10% YGS + Activin B; 4: 10% NC + IL-6; 5: 10% YGS + IL-6; 6: 10% NC + Activin B + IL-6; 7: 10% YGS + Activin B + IL-6; F: quantitative analysis of intracellular protein expression; F1: quantitative analysis of hepcidin intensity; F2: quantitative analysis of ferroportin intensity. 10% NC group: 10% normal serum; 10% NC + Activin B group: 10% normal serum with 50 ng/mL activin B; 10% YGS + Activin B group: 10% YGS-medicated serum with 50 ng/mL activin B; 10% NC + IL-6 group: 10% normal serum with 50 ng/mL IL-6; 10% YGS + IL-6 group: 10% YGS-medicated serum with 50 ng/mL IL-6; 10% NC + Activin B + IL-6 group: 10% normal serum with 50 ng/mL activin B and 50 ng/mL IL-6; 10% YGS + Activin B + IL-6 group: 10% YGS-medicated serum with 50 ng/mL activin B and 50 ng/mL IL-6. NC: negative control; YGS: Yigongsan decoction; HAMP: hepcidin antimicrobial peptide; Fpn: ferroportin; IL-6: interleukin-6. Statistical analysis was performed using one-way analysis of variance followed by the least significant difference test for multiple comparisons. Data were presented as mean ± standard deviation (n = 3). Compared with the 10% NC group, aP < 0.05; compared with the 10% NC + Activin B group, bP < 0.05; compared with the 10% NC + IL-6 group, cP < 0.05; compared with the 10% NC + Activin B + IL-6 group, dP < 0.05.
Figure 2 Effect of YGS-medicated serum on iron metabolism in vitro A: intracellular iron; B: extracellular iron; C: intracellular HAMP mRNA; D: intracellular Fpn mRNA expression; E: representative western blot of intracellular hepcidin and ferroportin; 1: 10% NC; 2: 10% NC + Activin B; 3: 10% YGS + Activin B; 4: 10% NC + IL-6; 5: 10% YGS + IL-6; 6: 10% NC + Activin B + IL-6; 7: 10% YGS + Activin B + IL-6; F: quantitative analysis of intracellular protein expression; F1: quantitative analysis of hepcidin intensity; F2: quantitative analysis of ferroportin intensity. 10% NC group: 10% normal serum; 10% NC + Activin B group: 10% normal serum with 50 ng/mL activin B; 10% YGS + Activin B group: 10% YGS-medicated serum with 50 ng/mL activin B; 10% NC + IL-6 group: 10% normal serum with 50 ng/mL IL-6; 10% YGS + IL-6 group: 10% YGS-medicated serum with 50 ng/mL IL-6; 10% NC + Activin B + IL-6 group: 10% normal serum with 50 ng/mL activin B and 50 ng/mL IL-6; 10% YGS + Activin B + IL-6 group: 10% YGS-medicated serum with 50 ng/mL activin B and 50 ng/mL IL-6. NC: negative control; YGS: Yigongsan decoction; HAMP: hepcidin antimicrobial peptide; Fpn: ferroportin; IL-6: interleukin-6. Statistical analysis was performed using one-way analysis of variance followed by the least significant difference test for multiple comparisons. Data were presented as mean ± standard deviation (n = 3). Compared with the 10% NC group, aP < 0.05; compared with the 10% NC + Activin B group, bP < 0.05; compared with the 10% NC + IL-6 group, cP < 0.05; compared with the 10% NC + Activin B + IL-6 group, dP < 0.05.
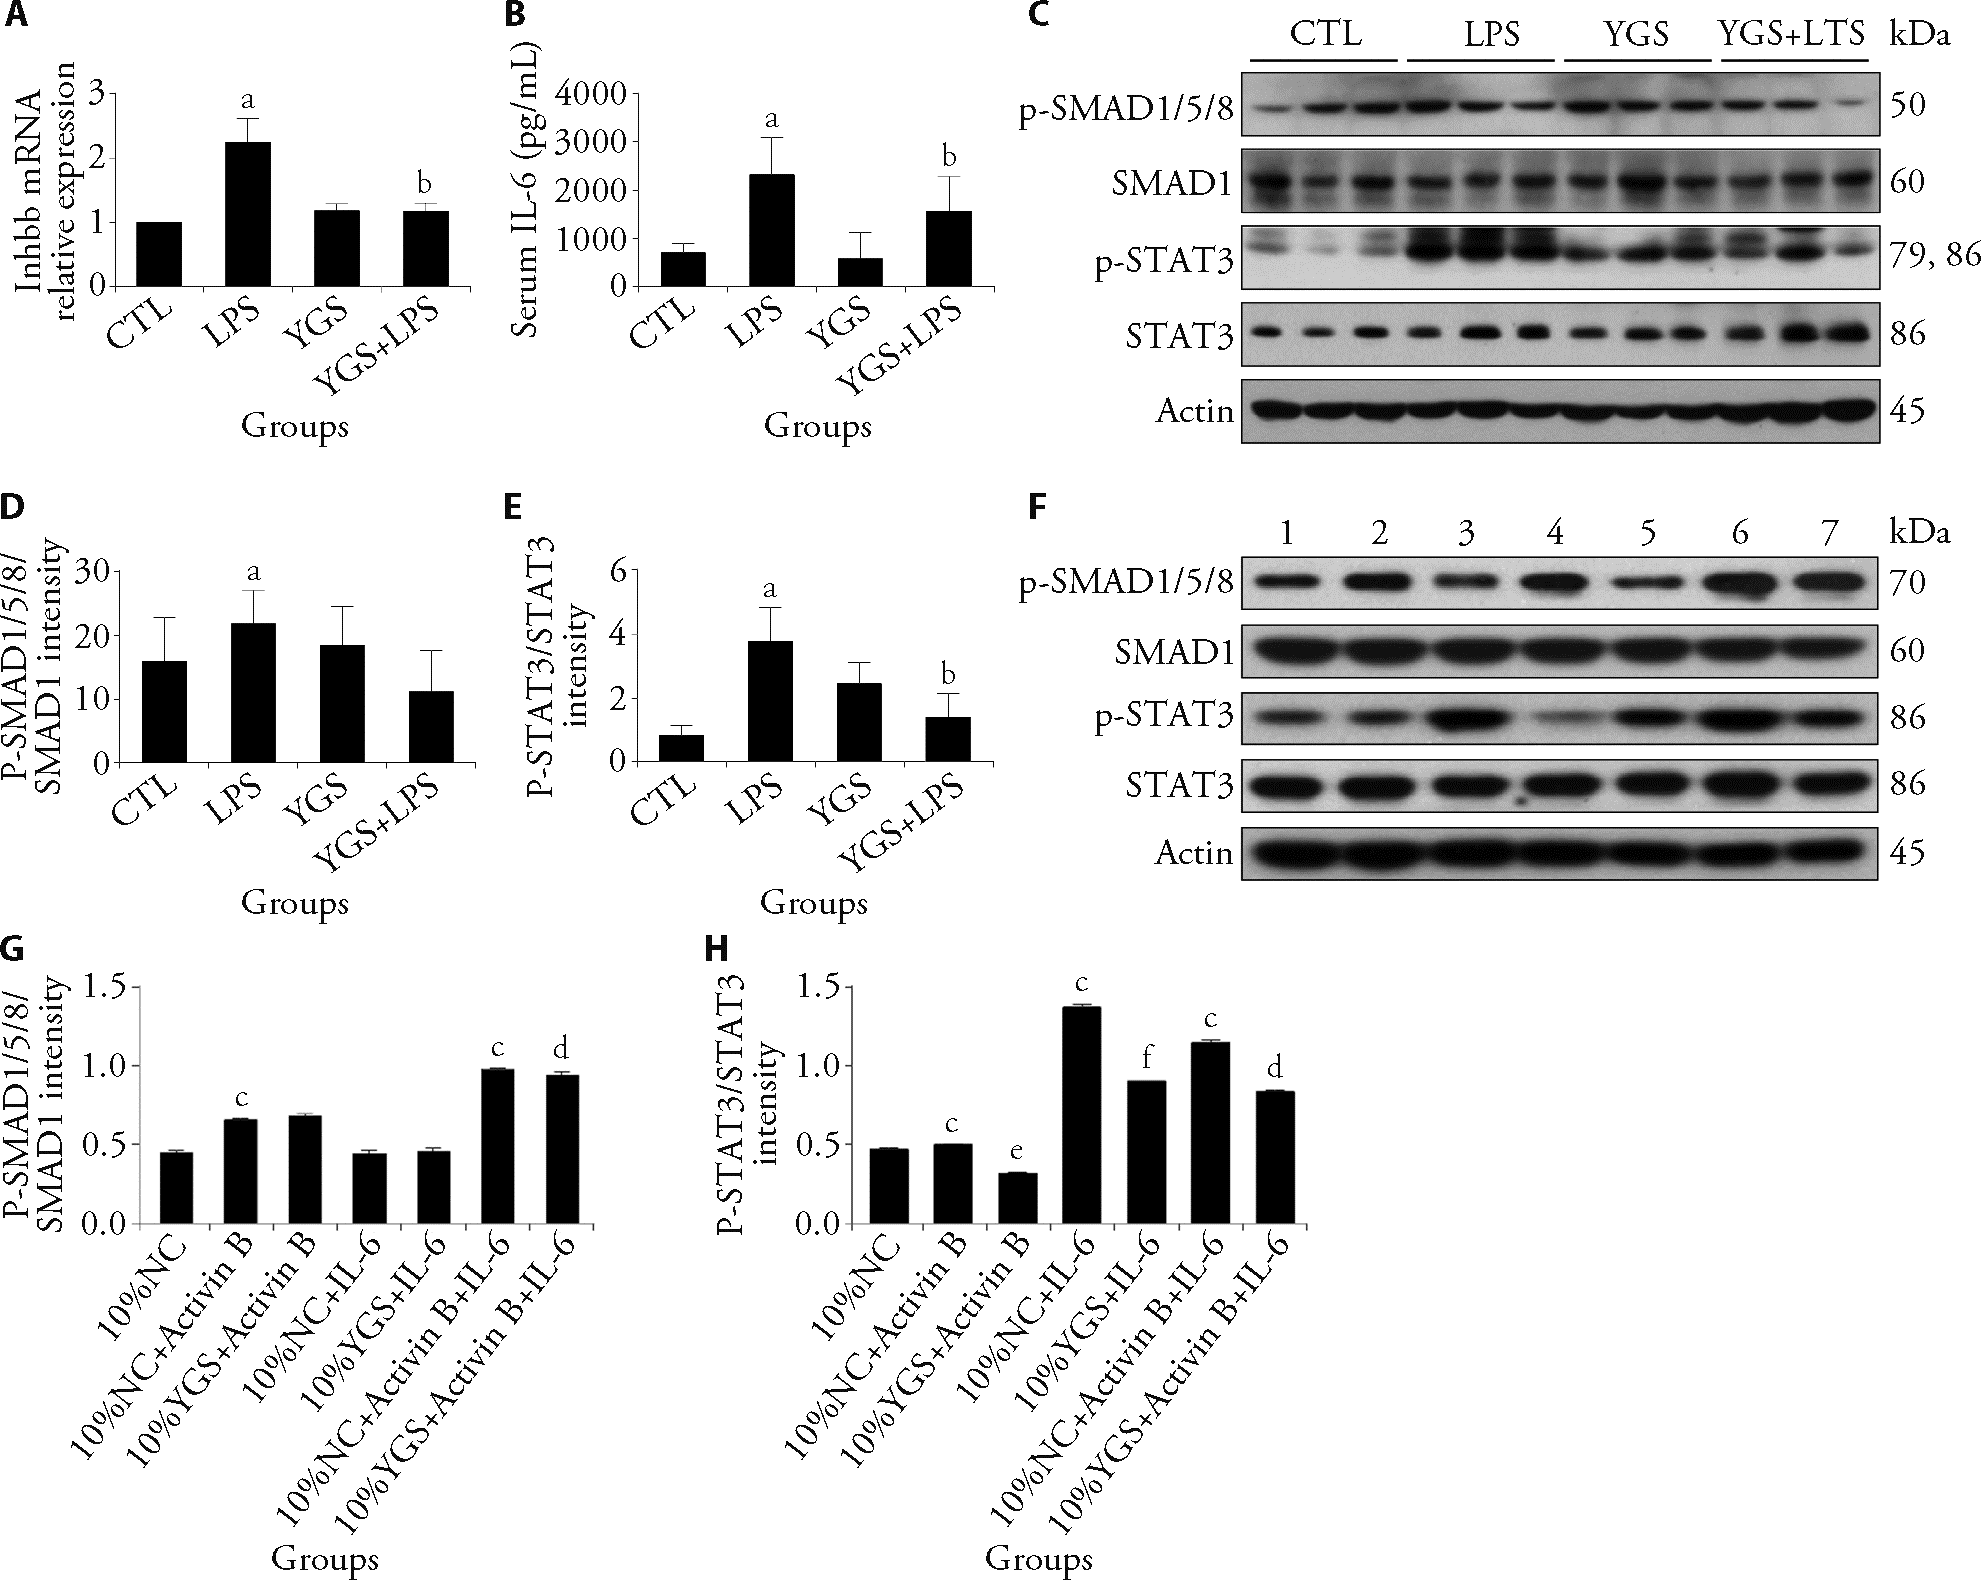
Figure 3 Effect of YGS on SMAD and STAT3 signaling pathway in vivo and vitro A: liver Inhbb mRNA relative expression; B: serum IL-6 level; C: representative Western blot of p-SMAD1/5/8, SMAD1, p-STAT3, STAT3 protein expressions in the liver; D: quantitative analysis of p-SMAD1/5/8/SMAD1 intensity ratio in the liver; E: quantitative analysis of p-STAT3/STAT3 intensity ratio in the liver; F: representative Western blot of intracellular p-SMAD1/5/8, SMAD1, p-STAT3, STAT3 protein expressions; 1: 10% NC; 2: 10% NC + Activin B; 3: 10% YGS + Activin B; 4: 10% NC + IL-6; 5: 10% YGS + IL-6; 6: 10% NC + Activin B + IL-6; 7: 10% YGS + Activin B + IL-6; G: quantitative analysis of intracellular p-SMAD1/5/8/SMAD1 intensity ratio; H: quantitative analysis of intracellular p-STAT3/STAT3 intensity ratio. CTL group: the same volume of water; LPS group: 1.5 mg·kg-1 LPS on day 8; YGS group: YGS 15.413 g·kg-1·d-1; YGS + LPS group: YGS 15.413 g·kg-1·d-1 + 1.5 mg/kg LPS. 10% NC group: 10% normal serum; 10% NC + Activin B group: 10% normal serum with 50 ng/mL activin B; 10% YGS + Activin B group: 10% YGS-medicated serum with 50 ng/mL activin B; 10% NC + IL-6 group: 10% normal serum with 50 ng/mL IL-6; 10% YGS + IL-6 group: 10% YGS-medicated serum with 50 ng/mL IL-6; 10% NC + Activin B + IL-6 group: 10% normal serum with 50 ng/mL activin B and 50 ng/mL IL-6; 10% YGS + Activin B + IL-6 group: 10% YGS-medicated serum with 50 ng/mL activin B and 50 ng/mL IL-6. CTL: control; YGS: Yigongsan decoction; LPS: lipopolysaccharide; NC: negative control; IL-6: interleukin-6; Inhbb: inhibin subunit beta B; SMAD: small mothers against decapentaplegic; STAT3: signal transducer and activator of transcription 3; p-: phosphorylated. Statistical analysis was performed using one-way analysis of variance followed by the least significant difference test for multiple comparisons. Data were presented as mean ± standard deviation (n = 6 for A-E, n = 3 for F-H). Compared with the CTL group, aP < 0.05; compared with the LPS group, b P < 0.05; compared with the 10% NC group, cP < 0.05; compared with the 10% NC + Activin B + IL-6 group, dP < 0.05; compared with the 10% NC + Activin B group, eP < 0.05; compared with the 10% NC + IL-6 group, fP < 0.05.
Figure 3 Effect of YGS on SMAD and STAT3 signaling pathway in vivo and vitro A: liver Inhbb mRNA relative expression; B: serum IL-6 level; C: representative Western blot of p-SMAD1/5/8, SMAD1, p-STAT3, STAT3 protein expressions in the liver; D: quantitative analysis of p-SMAD1/5/8/SMAD1 intensity ratio in the liver; E: quantitative analysis of p-STAT3/STAT3 intensity ratio in the liver; F: representative Western blot of intracellular p-SMAD1/5/8, SMAD1, p-STAT3, STAT3 protein expressions; 1: 10% NC; 2: 10% NC + Activin B; 3: 10% YGS + Activin B; 4: 10% NC + IL-6; 5: 10% YGS + IL-6; 6: 10% NC + Activin B + IL-6; 7: 10% YGS + Activin B + IL-6; G: quantitative analysis of intracellular p-SMAD1/5/8/SMAD1 intensity ratio; H: quantitative analysis of intracellular p-STAT3/STAT3 intensity ratio. CTL group: the same volume of water; LPS group: 1.5 mg·kg-1 LPS on day 8; YGS group: YGS 15.413 g·kg-1·d-1; YGS + LPS group: YGS 15.413 g·kg-1·d-1 + 1.5 mg/kg LPS. 10% NC group: 10% normal serum; 10% NC + Activin B group: 10% normal serum with 50 ng/mL activin B; 10% YGS + Activin B group: 10% YGS-medicated serum with 50 ng/mL activin B; 10% NC + IL-6 group: 10% normal serum with 50 ng/mL IL-6; 10% YGS + IL-6 group: 10% YGS-medicated serum with 50 ng/mL IL-6; 10% NC + Activin B + IL-6 group: 10% normal serum with 50 ng/mL activin B and 50 ng/mL IL-6; 10% YGS + Activin B + IL-6 group: 10% YGS-medicated serum with 50 ng/mL activin B and 50 ng/mL IL-6. CTL: control; YGS: Yigongsan decoction; LPS: lipopolysaccharide; NC: negative control; IL-6: interleukin-6; Inhbb: inhibin subunit beta B; SMAD: small mothers against decapentaplegic; STAT3: signal transducer and activator of transcription 3; p-: phosphorylated. Statistical analysis was performed using one-way analysis of variance followed by the least significant difference test for multiple comparisons. Data were presented as mean ± standard deviation (n = 6 for A-E, n = 3 for F-H). Compared with the CTL group, aP < 0.05; compared with the LPS group, b P < 0.05; compared with the 10% NC group, cP < 0.05; compared with the 10% NC + Activin B + IL-6 group, dP < 0.05; compared with the 10% NC + Activin B group, eP < 0.05; compared with the 10% NC + IL-6 group, fP < 0.05.
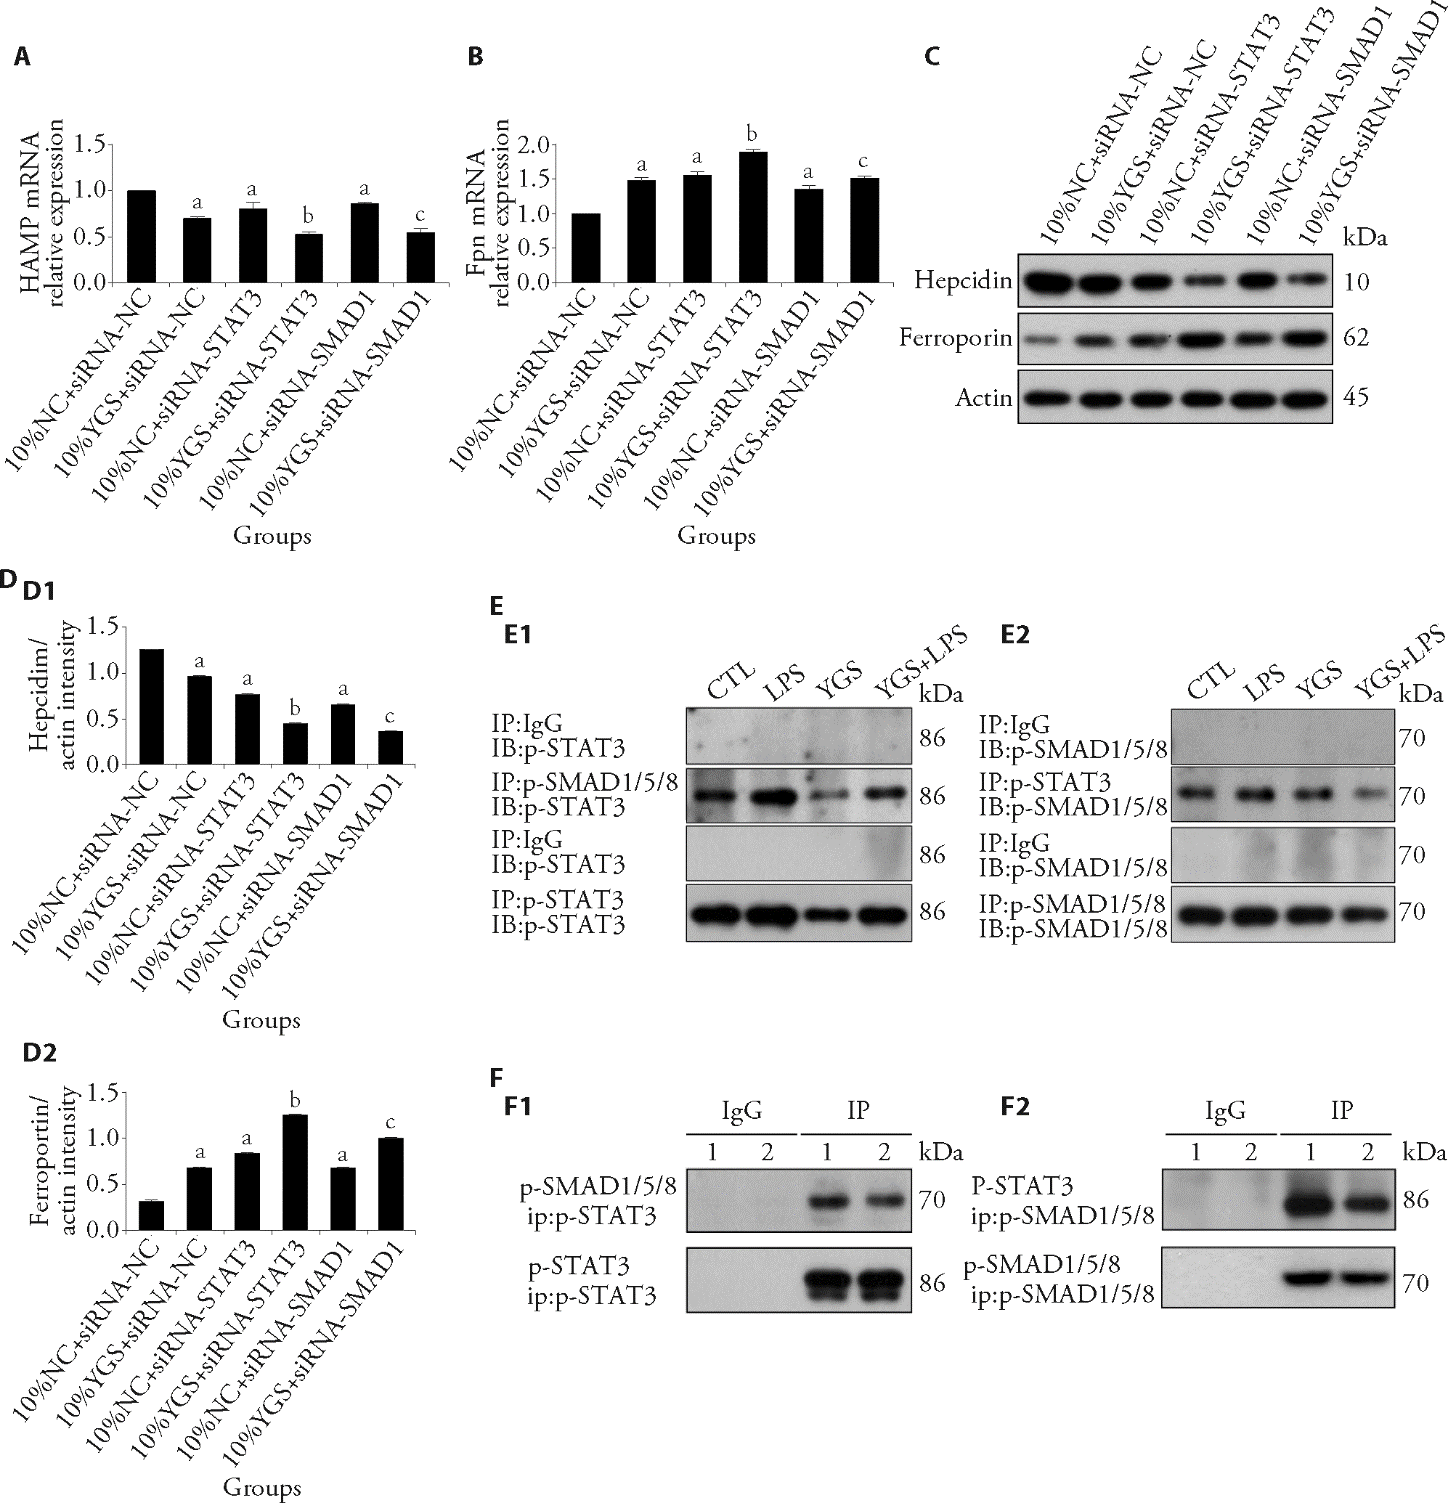
Figure 4 Effect of YGS on hepcidin-Fpn axis by the interaction between SMAD and STAT3 signaling pathway in vivo and vitro A: intracellular HAMP mRNA; B: intracellular Fpn mRNA expression; C: representative western blot of intracellular hepcidin and ferroportin; D: quantitative analysis of intracellular protein expression; D1: quantitative analysis of hepcidin intensity; D2: quantitative analysis of ferroportin intensity; E: in vivo co-IP assays demonstrating the interaction between p-SMAD1/5/8 and p-STAT3; E1: liver lysates were immunoprecipitated with an anti-p-STAT3 antibody or normal IgG (negative control), followed by immunoblotting with antibodies against p-SMAD1/5/8 and p-STAT3; E2: reciprocal co-IP was performed using an anti-p-SMAD1/5/8 antibody for immunoprecipitation, followed by immunoblotting with antibodies against p-STAT3 and p-SMAD1/5/8; F: in vitro co-IP assays confirming the interaction between p-SMAD1/5/8 and p-STAT3; F1: cell lysates were immunoprecipitated with an anti-p-STAT3 antibody or normal IgG, followed by immunoblotting for p-SMAD1/5/8 and p-STAT3; F2: reciprocal co-IP was performed using an anti-p-SMAD1/5/8 antibody for immunoprecipitation, followed by immunoblotting for p-STAT3 and p-SMAD1/5/8. 1: 10% NC + Activin B + IL-6 group; 2: 10% YGS + Activin B + IL-6 group,10% NC + siRNA-NC group: siRNA-NC transfection + 10% normal serum; 10% YGS + siRNA-NC group: siRNA-NC transfection + 10% YGS-medicated serum; 10% NC + siRNA-STAT3 group: siRNA-STAT3 transfection + 10% normal serum; 10% YGS + siRNA-STAT3 group: siRNA-STAT3 transfection + 10% YGS-medicated serum; 10% NC + siRNA-SMAD1 group: siRNA-SMAD1 transfection + 10% normal serum; 10% YGS + siRNA-SMAD1 group: siRNA-SMAD1 transfection + YGS-medicated serum. CTL group: the same volume of water; LPS group: 1.5 mg/kg LPS on day 8; YGS group: YGS 15.413 g·kg-1·d-1; YGS + LPS group: YGS 15.413 g·kg-1·d-1 + 1.5 mg·kg-1 LPS. 10% NC + Activin B + IL-6 group: 10% normal serum with 50 ng/mL activin B and 50 ng/mL IL-6; 10% YGS + Activin B + IL-6 group: 10% YGS-medicated serum with 50 ng/mL activin B and 50 ng/mL IL-6. CTL: control; YGS: Yigongsan decoction; LPS: lipopolysaccharide; NC: negative control; IL-6: interleukin-6; SMAD: small mothers against decapentaplegic; STAT3: signal transducer and activator of transcription 3; p-: phosphorylated; siRNA: small interfering RNA; co-IP: co-immunoprecipitation. Statistical analysis was performed using one-way analysis of variance followed by the least significant difference test for multiple comparisons. Data were presented as mean ± standard deviation (n = 3). Compared with the 10% NC + siRNA-NC group, aP < 0.05; compared with the 10% NC + siRNA-STAT3 group, bP < 0.05; compared with the 10% NC + siRNA-SMAD1 group, cP < 0.05.
Figure 4 Effect of YGS on hepcidin-Fpn axis by the interaction between SMAD and STAT3 signaling pathway in vivo and vitro A: intracellular HAMP mRNA; B: intracellular Fpn mRNA expression; C: representative western blot of intracellular hepcidin and ferroportin; D: quantitative analysis of intracellular protein expression; D1: quantitative analysis of hepcidin intensity; D2: quantitative analysis of ferroportin intensity; E: in vivo co-IP assays demonstrating the interaction between p-SMAD1/5/8 and p-STAT3; E1: liver lysates were immunoprecipitated with an anti-p-STAT3 antibody or normal IgG (negative control), followed by immunoblotting with antibodies against p-SMAD1/5/8 and p-STAT3; E2: reciprocal co-IP was performed using an anti-p-SMAD1/5/8 antibody for immunoprecipitation, followed by immunoblotting with antibodies against p-STAT3 and p-SMAD1/5/8; F: in vitro co-IP assays confirming the interaction between p-SMAD1/5/8 and p-STAT3; F1: cell lysates were immunoprecipitated with an anti-p-STAT3 antibody or normal IgG, followed by immunoblotting for p-SMAD1/5/8 and p-STAT3; F2: reciprocal co-IP was performed using an anti-p-SMAD1/5/8 antibody for immunoprecipitation, followed by immunoblotting for p-STAT3 and p-SMAD1/5/8. 1: 10% NC + Activin B + IL-6 group; 2: 10% YGS + Activin B + IL-6 group,10% NC + siRNA-NC group: siRNA-NC transfection + 10% normal serum; 10% YGS + siRNA-NC group: siRNA-NC transfection + 10% YGS-medicated serum; 10% NC + siRNA-STAT3 group: siRNA-STAT3 transfection + 10% normal serum; 10% YGS + siRNA-STAT3 group: siRNA-STAT3 transfection + 10% YGS-medicated serum; 10% NC + siRNA-SMAD1 group: siRNA-SMAD1 transfection + 10% normal serum; 10% YGS + siRNA-SMAD1 group: siRNA-SMAD1 transfection + YGS-medicated serum. CTL group: the same volume of water; LPS group: 1.5 mg/kg LPS on day 8; YGS group: YGS 15.413 g·kg-1·d-1; YGS + LPS group: YGS 15.413 g·kg-1·d-1 + 1.5 mg·kg-1 LPS. 10% NC + Activin B + IL-6 group: 10% normal serum with 50 ng/mL activin B and 50 ng/mL IL-6; 10% YGS + Activin B + IL-6 group: 10% YGS-medicated serum with 50 ng/mL activin B and 50 ng/mL IL-6. CTL: control; YGS: Yigongsan decoction; LPS: lipopolysaccharide; NC: negative control; IL-6: interleukin-6; SMAD: small mothers against decapentaplegic; STAT3: signal transducer and activator of transcription 3; p-: phosphorylated; siRNA: small interfering RNA; co-IP: co-immunoprecipitation. Statistical analysis was performed using one-way analysis of variance followed by the least significant difference test for multiple comparisons. Data were presented as mean ± standard deviation (n = 3). Compared with the 10% NC + siRNA-NC group, aP < 0.05; compared with the 10% NC + siRNA-STAT3 group, bP < 0.05; compared with the 10% NC + siRNA-SMAD1 group, cP < 0.05.
| 1. |
Brittenham GM, Moir-Meyer G, Abuga KM, et al. Biology of anemia: a public health perspective. J Nutr 2023; 153: S7-28.
DOI URL |
| 2. |
Pasricha SR, Tye-Din J, Muckenthaler MU, et al. Iron deficiency. Lancet 2021; 397: 233-48.
DOI URL |
| 3. |
GBD 2016 Disease and Injury Incidence and Prevalence Collaborators. Global, regional, and national incidence, prevalence, and years lived with disability for 328 diseases and injuries for 195 countries. Lancet 2017; 390: 1211-59.
DOI URL |
| 4. | Mironova OI, Panferov AS. Anemia of chronic diseases: current state of the problem and perspectives. Ter Arkh 2022; 94: 1349-54. |
| 5. |
Loveikyte R, van den Berg Y, van der Meulen-de Jong AE, et al. The role of hepcidin and an oral iron absorption test in identifying the root cause of anemia in patients with IBD. Nutrients 2023; 15: 3509.
DOI URL |
| 6. | Bondarchuk SV, Golovko KP, Ovchinnikov DV. Anemia of chronic diseases as an interdisciplinary problem. Russ Mil Med Acad Rep 2021; 40: 55-61. |
| 7. | Marques O, Weiss G, Muckenthaler MU. The role of iron in chronic inflammatory diseases: from mechanisms to treatment options in anemia of inflammation. Front Immunol 2022; 13: 1012738. |
| 8. | Cercamondi CI, Stoffel NU, Moretti D, et al. Iron homeostasis during anemia of inflammation: a prospective study of patients with tuberculosis. Blood 2023; 141: 2189-94. |
| 9. |
Ganz T. Anemia of inflammation. N Engl J Med 2019; 381: 1148-57.
DOI URL |
| 10. |
Ginzburg YZ. Hepcidin-ferroportin axis in health and disease. Vitam Horm 2019; 110: 17-45.
DOI PMID |
| 11. |
Wang CY, Babitt JL. Hepcidin regulation in the anemia of inflammation. Curr Opin Hematol 2016; 23: 189-97.
DOI URL |
| 12. |
Sebastiani G, Wilkinson N, Pantopoulos K. Pharmacological targeting of the hepcidin/ferroportin axis. Front Pharmacol 2016; 7: 160.
DOI PMID |
| 13. |
Rochette L, Gudjoncik A, Guenancia C, et al. The iron-regulatory hormone hepcidin: a possible therapeutic target? Pharmacol Ther 2015; 146: 35-52.
DOI URL |
| 14. | Kim SJ, Shin HJ, Lee BJ, et al. The antiinflammatory mechanism of Yigongsan in mouse peritoneal macrophages via suppression of NF-κB/caspase-1 activation. J Ethnopharmacol 2013; 146: 414-24. |
| 15. | Xue C, Zheng Q, Ji Y, et al. Yi Gong San decoction combined with conventional Western Medicine in treating anemia of chronic disease (spleen Qi deficiency type). Zhong Guo Zhong Xi Yi Jie He Za Zhi 2020; 40: 30-4. |
| 16. |
Weiss G, Ganz T, Goodnough LT. Anemia of inflammation. Blood 2019; 133: 40-50.
DOI PMID |
| 17. |
Xiao X, Alfaro-Magallanes VM, Babitt JL. Bone morphogenic proteins in iron homeostasis. Bone 2020; 138: 115495.
DOI URL |
| 18. | Zheng Q, Guan Y, Xia L, et al. Effect of Yi Gong San decoction on iron homeostasis in a mouse model of acute inflammation. Evid Based Complement Alternat Med 2022; 2022: 3127425. |
| 19. |
Rivera S, Ganz T. Animal models of anemia of inflammation. Semin Hematol 2009; 46: 351-7.
DOI PMID |
| 20. |
Wu R, Dong S, Cai FF, et al. Active compounds derived from Fuzheng Huayu formula protect hepatic parenchymal cells from apoptosis based on network pharmacology and experimental validation. J Ethnopharmacol 2024; 319: 117316.
DOI URL |
| 21. | Qin MY, Huang SQ, Zou XQ, et al. Drug-containing serum of rhubarb-astragalus capsule inhibits the epithelial-mesenchymal transformation of HK-2 by down-regulating the BMP/SMAD signaling pathway. Zhong Guo Zhong Xi Yi Jie He Za Zhi 2022; 42: 601-6. |
| 22. |
Cai FF, Wu R, Song YN, et al. Yinchenhao decoction alleviates liver fibrosis by regulating bile acid metabolism and TGF-β/SMAD/ERK signalling pathways. J Ethnopharmacol 2024; 319: 117237.
DOI URL |
| 23. |
Wang C, Fang Z, Zhu Z, et al. Reciprocal regulation between hepcidin and erythropoiesis and its therapeutic application in erythroid disorders. Exp Hematol Oncol 2022; 11: 37.
DOI |
| 24. |
Ginzburg YZ. Hepcidin and its multiple partners: complex regulation of iron metabolism in health and disease. Vitam Horm 2023; 123: 249-84.
DOI PMID |
| 25. | Roth MP, Meynard D, Coppin H. Regulators of hepcidin expression. Vitam Horm 2019; 110: 101-29. |
| 26. | Lam LKM, Murphy S, Kokkinaki D, et al. DNA binding to TLR9 expressed by red blood cells promotes innate immune activation and anemia. Sci Transl Med 2021; 13: eabb7349. |
| 27. | Besson-Fournier C, Gineste A, Latour C, et al. Hepcidin upregulation by inflammation is independent of Smad1/5/8 signaling by activin B. Blood 2017; 129: 293-303. |
| 28. |
Kanamori Y, Sugiyama M, Hashimoto O, et al. Regulation of hepcidin expression by inflammation-induced activin B. Sci Rep 2016; 6: 38702.
DOI PMID |
| 29. | Sadakane H, Matsumura M, Murakami M, et al. Weak response of bovine hepcidin induction to iron through decreased expression of Smad4. FASEB J 2023; 37: 1-12. |
| 30. |
Silvestri L, Nai A, Dulja A, et al. Hepcidin and the BMP-SMAD pathway: an unexpected liaison. Vitam Horm 2019; 110: 71-99.
DOI PMID |
| 31. | Varga E, Pap R, Janosa G, et al. IL-6 regulates hepcidin expression via the BMP/SMAD pathway by altering BMP6, TMPRSS6 and TfR2 expressions at normal and increased hepcidin levels. Cell 2023; 12: 193. |
| 32. | Zhang Y, Li MM, Zeng F, et al. Study to establish the role of JAK2 and SMAD1/5/8 pathways in the inhibition of hepcidin by polysaccharides from Angelica sinensis. J Ethnopharmacol 2019; 239: 111935. |
| 33. |
Huang H, Constante M, Layoun A, et al. Contribution of STAT3 and SMAD4 pathways to the regulation of hepcidin by opposing stimuli. Blood 2009; 113: 3593-9.
DOI PMID |
| 34. |
Farida B, Ibrahim KG, Abubakar B, et al. Iron deficiency and its epigenetic effects on iron homeostasis. J Trace Elem Med Biol 2023; 78: 127203.
DOI URL |
| 35. | Li XX, Zhang Y, Wang Z, et al. Shisiwei Jianzhong decoction ameliorates aplastic anemia by regulating hematopoietic stem cell proliferation and differentiation. J Tradit Chin Med 2025; 45: 963-9. |
| 36. | Chen Y, Liu H, Zhao M, et al. Jiawei Erzhi pill inhibits ferroptosis in vascular endothelial cells for the treatment of atherosclerosis. J Tradit Chin Med 2025; 45: 1330-41. |
| 37. | Wang J, Sun L, Zhang Q, et al. Yisui Shengxue pills suppress HIF-1alpha-mediated erythropoietin dysregulation in beta-thalassemia. J Tradit Chin Med 2024; 44: 1258-68. |
| Viewed | ||||||
|
Full text |
|
|||||
|
Abstract |
|
|||||