Journal of Traditional Chinese Medicine ›› 2023, Vol. 43 ›› Issue (1): 95-104.DOI: 10.19852/j.cnki.jtcm.20221017.001
• Original articles • Previous Articles Next Articles
Mitochondrial dysfunction in a rat model and the related risk of metabolic disorders
LI Han1, HUANG Xiaomin2, CAI Haiyang1, HEROK George3, HE Jing1, SU Yixun2, LI Weihong1( ), YI Chenju2(), OLIVER Brian G3, CHEN Hui3
- 1 Faculty of Basic Medical Sciences, Chengdu University of Traditional Chinese Medicine, Chengdu 611137, China
2 Research Centre, the Seventh Affiliated Hospital of Sun Yat-Sen University, Shenzhen 518107, China
3 School of Life Sciences, University of Technology Sydney, Sydney, New South Wales 2059, Australia
-
Received:2021-09-16Accepted:2021-12-11Online:2023-02-15Published:2023-01-10 -
Contact:LI Weihong,YI Chenju -
About author:Prof. LI Weihong, Faculty of Basic Medical Sciences, Chengdu University of Traditional Chinese Medicine, Chengdu 611137, China. liwihong@cdutcm.edu.cn. Telephone:+86-13419189905; +86-13882014290
Associate Prof. YI Chenju, Research Centre, the Seventh Affiliated Hospital of Sun Yat-sen University, Shenzhen 518107, China. yichj@mail.sysu.edu.cn;
-
Supported by:The Role of Mitochondrial Intergrity in the Pathophysiology of Kidney Yang Deficiency(81750110554);Central Mechanisms of Transgenerational Phenotype of Kidney Yang Deficiency in a Rat Model(2018HH0085);Molecular Mechanism of Blocking Cys259 and DD-mediated p75NTR Signaling Pathway to Delay the Progression of Alzheimer's Disease(NSFC 81971309);Mechanism Study of Cys259 Site and DD Domain of p75NTR as New Targets for the Treatment of Alzheimer's Disease(2019A1515011333);Research on Glial Connexin as a New Target for Alzheimer's Disease Treatment(F7201931620002)
Cite this article
LI Han, HUANG Xiaomin, CAI Haiyang, HEROK George, HE Jing, SU Yixun, LI Weihong, YI Chenju, OLIVER Brian G, CHEN Hui. Mitochondrial dysfunction in a rat model and the related risk of metabolic disorders[J]. Journal of Traditional Chinese Medicine, 2023, 43(1): 95-104.
share this article
Table 1 Biometric parameters and blood metabolic markers in male offspring at 13 weeks
| Parameter | Control (n = 10) | KYD (n = 10) |
|---|---|---|
| Birth weight at birth (g) | 7.800±0.200 | 4.780±0.287b |
| Body weight at 13 weeks (g) | 356.850±6.134 | 325.200±11.404a |
| Liver (g) | 10.285±0.270 | 10.680±0.236 |
| Liver as a percentage of body weight (%) | 2.883±0.063 | 3.323±0.140a |
| Kidney (g) | 2.456±0.100 | 2.059±0.065a |
| Kidney as a percentage of body weight (%) | 0.705±0.036 | 0.643±0.036 |
| Brown adipose tissue (g) | 0.497±0.051 | 0.465±0.054 |
| Brown adipose tissue as a percentage of body weight (%) | 0.139±0.015 | 0.147±0.021 |
| White adipose tissue (g) | 4.961±0.354 | 2.800±0.310b |
| White adipose tissue as a percentage of body weight (%) | 1.391±0.098 | 0.856±0.082b |
| Sketeal muscle (g) | 0.534±0.047 | 0.694±0.044a |
| Sketeal muscle as a percentage of body weight (%) | 0.152±0.014 | 0.218±0.019a |
| Serum corticosterone (ng/mL) | 22.264±0.771 | 15.190±1.415a |
| Serum T3 (ng/mL) | 3.841±0.152 | 3.675±0.113 |
| Blood glucose (mM) | 8.050±0.371 | 7.825±0.508 |
| Serum LDL (mM) | 1.105±0.062 | 1.257±0.027a |
| Serum cholesterol (mM) | 2.210±0.081 | 2.763±0.121b |
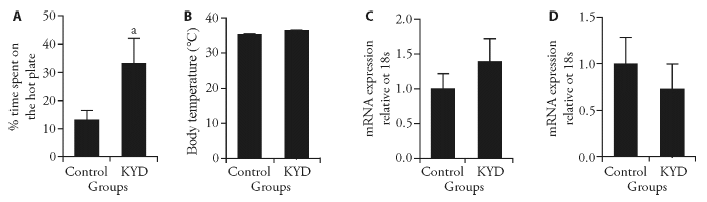
Figure 1 Markers involved in temperature and thermogenesis A: hot plate test; B: body temperature; C: mRNA expression of UCP1 in the BAT; D: mRNA expression of UCP1 in the skeletal muscle. KYD: kidney Yang deficiency; UCP1: uncoupling protein 1; BAT: brown adipose tissue. Results are expressed as mean ± standard error of the mean, n = 6-10. aP < 0.05, vs control.
Figure 1 Markers involved in temperature and thermogenesis A: hot plate test; B: body temperature; C: mRNA expression of UCP1 in the BAT; D: mRNA expression of UCP1 in the skeletal muscle. KYD: kidney Yang deficiency; UCP1: uncoupling protein 1; BAT: brown adipose tissue. Results are expressed as mean ± standard error of the mean, n = 6-10. aP < 0.05, vs control.
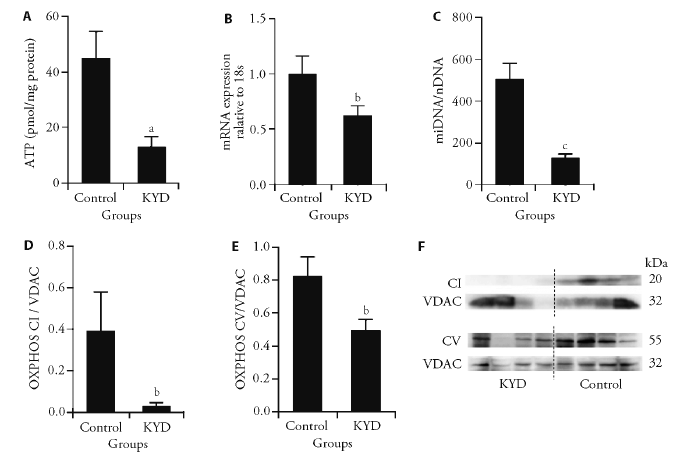
Figure 2 Mitochondrial metabolic markers in the BAT A: ATP levels; B; peroxisome PCG1α mRNA expression; C: mitoDNA copy number; D: oxidative phosphorylation complexes CI; E: CV in the BAT in male offspring at 13 weeks; F: total and mitochondrial protein from brown adipose tissue. BAT: brown adipose tissue; PCG1α: peroxisome proliferator-activated receptor gamma coactivator 1-alpha; mitoDNA: mitochondrial DNA; OXPHOS CV: the complexes V of the oxidative phosphorylation system; OXPHOS CI: the complexes I of the oxidative phosphorylation system; KYD: kidney Yang deficiency; ATP: adenosine-triphosphate; Results are expressed as mean ± standard error of the mean, n = 4-6. aP < 0.05, bP < 0.01, cP < 0.001, vs control.
Figure 2 Mitochondrial metabolic markers in the BAT A: ATP levels; B; peroxisome PCG1α mRNA expression; C: mitoDNA copy number; D: oxidative phosphorylation complexes CI; E: CV in the BAT in male offspring at 13 weeks; F: total and mitochondrial protein from brown adipose tissue. BAT: brown adipose tissue; PCG1α: peroxisome proliferator-activated receptor gamma coactivator 1-alpha; mitoDNA: mitochondrial DNA; OXPHOS CV: the complexes V of the oxidative phosphorylation system; OXPHOS CI: the complexes I of the oxidative phosphorylation system; KYD: kidney Yang deficiency; ATP: adenosine-triphosphate; Results are expressed as mean ± standard error of the mean, n = 4-6. aP < 0.05, bP < 0.01, cP < 0.001, vs control.
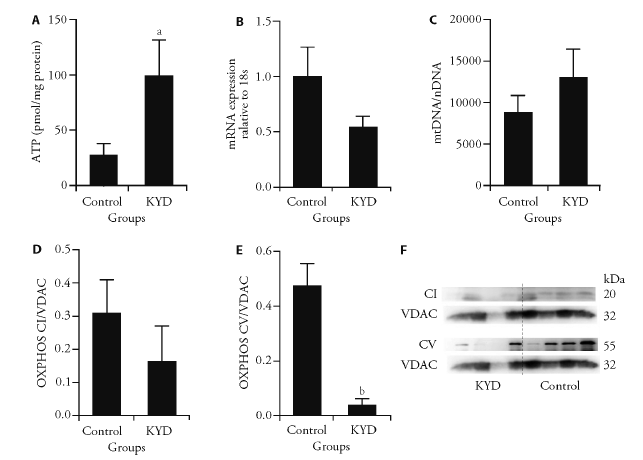
Figure 3 Mitochondrial metabolic markers in the muscle A: ATP levels; B: PCG1α mRNA expression; C: mitoDNA copy number; D: oxidative phosphorylation complexes CI and, E: CV in the skeletal muscle in male offspring at 13 weeks; F: total and mitochondrial protein was extracted from skeletal muscle. Control: normal SD mouse. ATP: adenosine-triphosphate; PCG1α: peroxisome proliferator-activated receptor gamma coactivator 1-alpha; mitoDNA: mitochondrial DNA; OXPHOS CV: the complexes V of the oxidative phosphorylation system; OXPHOS CI: the complexes I of the oxidative phosphorylation system; KYD: kidney Yang deficiency. Results are expressed as mean ± standard error of the mean, n = 4-6. aP < 0.05, bP < 0.01, vs Control.
Figure 3 Mitochondrial metabolic markers in the muscle A: ATP levels; B: PCG1α mRNA expression; C: mitoDNA copy number; D: oxidative phosphorylation complexes CI and, E: CV in the skeletal muscle in male offspring at 13 weeks; F: total and mitochondrial protein was extracted from skeletal muscle. Control: normal SD mouse. ATP: adenosine-triphosphate; PCG1α: peroxisome proliferator-activated receptor gamma coactivator 1-alpha; mitoDNA: mitochondrial DNA; OXPHOS CV: the complexes V of the oxidative phosphorylation system; OXPHOS CI: the complexes I of the oxidative phosphorylation system; KYD: kidney Yang deficiency. Results are expressed as mean ± standard error of the mean, n = 4-6. aP < 0.05, bP < 0.01, vs Control.
Table 2 Biometric parameters and blood metabolic markers in male offspring fed a HFD
| Item | Control-chow (n = 6) | KYD-chow (n = 6) | Control-HFD (n = 6) | KYD-HFD (n = 6) | |
|---|---|---|---|---|---|
| Body weight before the diet (g) | 53.000 ± 0.512 | 50.833 ± 1.426 | 52.000 ± 1.348 | 53.000 ± 0.688 | |
| Body weight at endpoint (g) | 375.000 ± 9.000 | 323.000 ± 15.000a | 442.000 ± 12.000b | 380.000 ± 9.000df | |
| Caloric intake (kJ/d per rat) | 271.000 ± 16.000 | 275.000 ± 14.000 | 348.000 ± 12.000a | 403.000 ± 35.000f | |
| Liver (g) | 11.787 ± 0.415 | 10.721 ± 0.891 | 13.657 ± 0.907 | 14.203 ± 0.784f | |
| Liver as a percentage of body weight (%) | 2.965 ± 0.202 | 3.011 ± 0.071 | 3.163 ± 0.152 | 3.712 ± 0.090f | |
| White adipose tissue (g) | 4.993 ± 0.822 | 3.562 ± 0.571 | 9.758 ± 1.710a | 8.465 ± 0.904e | |
| White adipose tissue as a percentage of body weight (%) | 1.275 ± 0.203 | 0.894 ± 0.080 | 1.883 ± 0.222 a | 2.200 ± 0.203f | |
| Sketeal muscle (g) | 0.717 ± 0.043 | 0.744 ± 0.057 | 0.824 ± 0.035 | 0.781 ± 0.024 | |
| Sketeal muscle as a percentage of body weight (%) | 0.184 ± 0.010 | 0.199 ± 0.003 | 0.200 ± 0.009 | 0.202 ± 0.007 | |
| Blood insulin (ng/mL) | 0.147 ± 0.026 | 0.124 ± 0.013 | 0.291 ± 0.046b | 0.154± 0.031d | |
| Serum LDL (mM) | 1.199 ± 0.067 | 1.414 ± 0.054a | 1.489 ± 0.075b | 2.008 ± 0.080cf | |
| Serum Cholesterol (mM) | 2.514 ± 0.050 | 2.712 ± 0.080 | 3.000 ± 0.184a | 3.515 ± 0.173ce | |
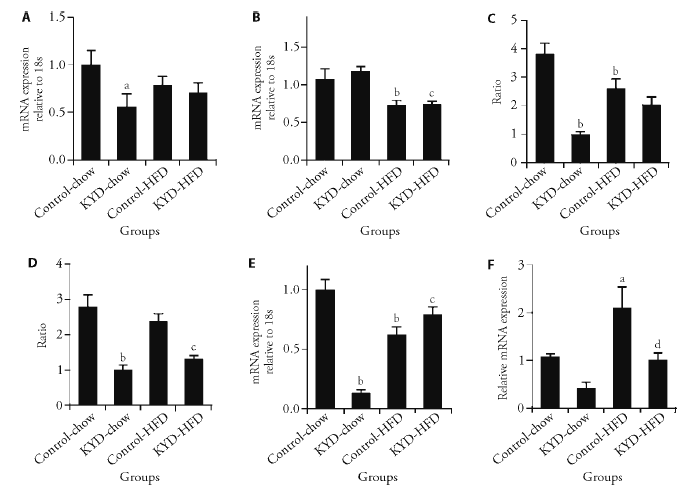
Figure 4 Energy metabolic regulators in the muscle and liver A: PCG1α mRNA expression; B: PPARγ mRNA expression; C: ratios between (IRS1 and total IRS1; D: ratios between between Akt and total Akt in the sketela muscle; E: mRNA expression of FOXO1; F: mRNA expression of CYP7A1 in the liver in chow and HFD-fed rats at 13 weeks. PCG1α: peroxisome proliferator-activated receptor gamma coactivator 1-alpha; PPARγ: peroxisome proliferator-activated receptor gamma; IRS1: p-insulin receptor substrate 1; Akt: p-protien kinase B; FOXO: forkhead box protein O; CYP7A1: cholesterol 7 alpha-hydroxylase; KYD: kidney Yang deficiency; HFD: high-fat diet; ATP: adenosine-triphosphate. Results are expressed as mean ± standard error of the mean, n = 6. aP < 0.05, bP < 0.01, vs Control-chow; cP < 0.01 vs KYD-chow; dP < 0.01vs Control-HFD.
Figure 4 Energy metabolic regulators in the muscle and liver A: PCG1α mRNA expression; B: PPARγ mRNA expression; C: ratios between (IRS1 and total IRS1; D: ratios between between Akt and total Akt in the sketela muscle; E: mRNA expression of FOXO1; F: mRNA expression of CYP7A1 in the liver in chow and HFD-fed rats at 13 weeks. PCG1α: peroxisome proliferator-activated receptor gamma coactivator 1-alpha; PPARγ: peroxisome proliferator-activated receptor gamma; IRS1: p-insulin receptor substrate 1; Akt: p-protien kinase B; FOXO: forkhead box protein O; CYP7A1: cholesterol 7 alpha-hydroxylase; KYD: kidney Yang deficiency; HFD: high-fat diet; ATP: adenosine-triphosphate. Results are expressed as mean ± standard error of the mean, n = 6. aP < 0.05, bP < 0.01, vs Control-chow; cP < 0.01 vs KYD-chow; dP < 0.01vs Control-HFD.
| 1 | Chan YL, Oliver BG, Chen H. What lessons have we learnt about the impact of maternal cigarette smoking from animal models? Clin Exp Pharmacol Physiol 2020; 2: 337-44. |
| 2 | Dudkina NV, Kouřil R, Peters K, Braun H-P, Boekema EJ. Structure and function of mitochondrial supercomplexes. Biochimica et Biophysica Acta (BBA) - Bioenergetics 2010; 6-7: 664-70. |
| 3 |
Chan YL, Saad S, Machaalani R, et al. Maternal cigarette smoke exposure worsens neurological outcomes in adolescent offspring with hypoxic-ischemic injury. Front Mol Neurosci 2017; 10: 306.
DOI PMID |
| 4 |
Chan YL, Saad S, Pollock C, et al. Impact of maternal cigarette smoke exposure on brain inflammation and oxidative stress in male mice offspring. Sci Rep 2016; 6: 25881.
DOI PMID |
| 5 | Li G, Chan YL, Sukjamnong S, et al. A mitochondrial specific antioxidant reverses metabolic dysfunction and fatty liver induced by maternal cigarette smoke in mice. Nutrients 2019; 7: 1669. |
| 6 | Li G, Chan YL, Nguyen LT, et al. Impact of maternal e-cigarette vapor exposure on renal health in the offspring. Ann NY Acad Sci 2019; 1: 65-77. |
| 7 | Zhao T, Wang H, Yu C, et al. Classification and differentiation between kidney Yang and Yin decficiency syndromes in TCM based on decision tree analysis method. Int J Clin Exp Med 2016; 11: 21888-99. |
| 8 | Hutchison CAr, Newbold JE, Potter SS, Edgell MH. Maternal inheritance of mammalian mitochondrial DNA. Nature 1974; 5475: 536-8. |
| 9 | Luo SM, Ge ZJ, Wang ZW, et al. Unique insights into maternal mitochondrial inheritance in mice. Proc Natl Acad Sci 2013; 32: 13038-43. |
| 10 | Hendriks KDW, Brüggenwirth IMA, Maassen H, et al. Renal temperature reduction progressively favors mitochondrial ROS production over respiration in hypothermic kidney preservation. J Transl Med 2019; 1: 265. |
| 11 | Mollica MP, Lionetti L, Crescenzo R, et al. Cold exposure differently influences mitochondrial energy efficiency in rat liver and skeletal muscle. FEBS Lett 2005; 9: 1978-82. |
| 12 | Zhao L, Wu H, Qiu M, et al. Metabolic signatures of kidney Yang deficiency syndrome and protective effects of two herbal extracts in rats using GC/TOF MS. Evid Based Complement Alternat Med 2013; 2013: 540957. |
| 13 | Tang N, Liu L, Qiu H, Shi W, Mao D. Analysis of gene expression and functional changes of adrenal gland in a rat model of kidney Yang deficiency syndrome treated with Sini decoction. Exp Ther Med 2018; 4: 3107-15. |
| 14 | Sheng Z, Zhang L, Zha L, Shi S, Gu T. The pituitary gland in patients with kidney Yang deficiency-the changes in Adrenal cortex system. Shanghai Zhong Yi Yao Da Xue Xue Bao 1979; 2: 34-7. |
| 15 | Shen Z. The location of deficiency syndrome of kidney Yang. Chin Med J (Engl) 1999; 11: 973-5. |
| 16 | Malikov D. Traditional Chinese Medicine approach to hypothyroidism. Int J Complementary Altern Med 2016; 1: 00142. |
| 17 | Jang Y, Kim JH, Lee H, Lee K, Ahn SH. A quantile regression approach to explain the relationship of fatigue and cortisol, cytokine among Koreans with hepatitis B. Sci rep 2018; 1: 16434. |
| 18 | Adam EK, Quinn ME, Tavernier R, McQuillan MT, Dahlke KA, Gilbert KE. Diurnal cortisol slopes and mental and physical health outcomes: a systematic review and Meta-analysis. Psychoneuro-endocrinology 2017; 83: 25-41. |
| 19 | Ruiz-Núñez B, Tarasse R, Vogelaar EF, Janneke Dijck-Brouwer DA, Muskiet FAJ.Higher prevalence of "Low T3 Syndrome" in patients with chronic fatigue syndrome: a case-control study. Front Endocrinol 2018; 9: 97. |
| 20 | Rajagopal MC, Brown JW, Gelda D, et al. Transient heat release during induced mitochondrial proton uncoupling. Commun Biol 2019; 1: 279. |
| 21 | Yoon JC, Ng A, Kim BH, Bianco A, Xavier RJ, Elledge SJ. Wnt signaling regulates mitochondrial physiology and insulin sensitivity. Genes Dev 2010; 14: 1507-18. |
| 22 | Miotto PM, McGlory C, Holloway TM, Phillips SM, Holloway GP. Sex-differences in mitochondrial respiratory function in human skeletal muscle. Am J Physiol: Regul, Integr Comp Physiol 2018; 6: R909-15. |
| 23 | Pinti MV, Fink GK, Hathaway QA, Durr AJ, Kunovac A, Hollander JM.Mitochondrial dysfunction in type 2 diabetes mellitus: an organ-based analysis. AJP Endocrino Metab 2019; 2: E268- 85. |
| 24 | You B, Dun Y, Zhang W, et al. Anti-insulin resistance effects of salidroside through mitochondrial quality control. J Endocrinol 2020; 2: 383. |
| 25 |
Koves TR, Ussher JR, Noland RC, et al. Mitochondrial overload and incomplete fatty acid oxidation contribute to skeletal muscle insulin resistance. Cell metab 2008; 7: 45-56.
DOI PMID |
| 26 | Lionetti L, Mollica MP, Crescenzo R, et al. Skeletal muscle subsarcolemmal mitochondrial dysfunction in high-fat fed rats exhibiting impaired glucose homeostasis. Int J Obes 2007; 10: 1596-604. |
| 27 | Li WH, Li QJ, Li WZ, et al. The Fourier transform infrared spectra of the key organs derived from Kidney (Shen)-Yang deficiency syndrome mice. Chin J Integr Med 2014; 11: 829-34. |
| 28 | Lyttleton J. 12 - Diet and lifestyle. In: LyttletonJ, Treatment of infertility with Chinese Medicine Second Edition: Churchill Livingstone 2013:ed.406-40. |
| 29 | Chen H, Ng JPM, Bishop DP, Milthorpe BK, Valenzuela SM. Gold nanoparticles as cell regulators: beneficial effects of gold nanoparticles on the metabolic profile of mice with pre-existing obesity. J Nanobiotechnol 2018; 1: 88. |
| 30 | Chen H, Ng JPM, Tan Y, et al. Gold nanoparticles improve meta-bolic profile of mice fed a high-fat diet. J Nanobiotechnol 2018; 1: 11. |
| 31 | Komalla V, Sheikholeslami B, Li G, et al. Impact of a cargo-less liposomal formulation on dietary obesity-related metabolic disorders in mice. Int J Mol Sci 2020; 21: 7640. |
| 32 | Chen H, Simar D, Pegg K, Saad S, Palmer C, Morris M. Exendin-4 is effective against metabolic disorders induced by intrauterine and postnatal overnutrition in rodents. Diabetologia 2014; 3: 614-22. |
| 33 |
Chan YL, Saad S, Al-Odat I, et al. Maternal L-Carnitine supplementation improves brain health in offspring from cigarette smoke exposed mothers. Front Mol Neurosci 2017; 10: 33.
DOI PMID |
| 34 | Lyttleton J. 4-diagnosis and treatment of female infertility. In: LyttletonJ,ed. Treatment of Infertility with Chinese Medicine (Second Edition): Churchill Livingstone; 2013: 66-139. |
| 35 | Ray B, Mallick HN, Kumar VM. Changes in thermal preference, sleep-wakefulness, body temperature and locomotor activity of rats during continuous recording for 24 hours. Behav Brain Res 2004; 2: 519-26. |
| 36 | Cedikova M, Kripnerová M, Dvorakova J, et al. Mitochondria in white, brown, and beige adipocytes. Stem Cells Int 2016; 2016: 6067349. |
| 37 | Argyropoulos G, Harper ME. Uncoupling proteins and thermoregulation. J Appl Physiol 2002; 5: 2187-98. |
| 38 | Enerback S, Jacobsson A, Simpson EM, et al. Mice lacking mitochondrial uncoupling protein are cold-sensitive but not obese. Nature 1997; 6628: 90-4. |
| 39 | Lee SH, Kwak SC, Kim DK, et al. Effects of Huangbai (Phellodendri Cortex) and three other herbs on GnRH and GH levels in GT1-7 and GH3 cells. Evidence-based complementary Altern Med: eCAM 2016;2016: 9389028. |
| 40 | Xian YF, Mao QQ, Ip SP, Lin ZX, Che CT. Comparison on the anti-inflammatory effect of Cortex Phellodendri Chinensis and Cortex Phellodendri amurensis in 12-O-tetradecanoyl-phorbol-13-acetate-induced ear edema in mice. J Ethnopharmacol 2011; 3: 1425-30. |
| 41 | Sun Y, Lenon GB, Yang AWH. Phellodendri Cortex:a phytochemical, pharmacological, and pharmacokinetic review. Evidence-based complementary Altern Med: eCAM 2019; 2019: 7621929. |
| 42 |
Ravussin E, Galgani JE. The implication of brown adipose tissue for humans. Annu Rev Nutr 2011; 31: 33-47.
DOI PMID |
| 43 | Shu Y, Jia J, Xu XL, Wang ZX. Observation on pulse hemodynamics in 57 patients with kidney deficiency. Neimenggu Zhong Yi Yao 2000; 4: 5-6. |
| 44 | Cecchino GN, Seli E, Alves da Motta EL, García-Velasco JA. The role of mitochondrial activity in female fertility and assisted reproductive technologies: overview and current insights. Reprod BioMed Online 2018; 6: 686-97. |
| 45 | Kumar DP, Sangeetha N. Mitochondrial DNA mutations and male infertility. Indian J Hum Genet 2009; 3: 93-7. |
| 46 | Handschin C, Choi CS, Chin S, et al. Abnormal glucose homeostasis in skeletal muscle specific PGC-1alpha knockout mice reveals skeletal muscle pancreatic b cell crosstalk. J Clin Invest 2007; 11: 3463-74. |
| 47 | Gerhart-Hines Z, Rodgers JT, Bare O, et al. Metabolic control of muscle mitochondrial function and fatty acid oxidation through SIRT1/PGC-1alpha. EMBO J 2007; 7: 1913-23. |
| 48 | Zhang W, Wang W, Shi T, et al. Changes of plasma lipid peroxide, high-density lipoprotein cholesterol, and its subcomponent levels in elderly patients with kidney deficiency. Zhong Yi Za Zhi 1989; 2: 43-6. |
| 49 | Liu F, Shan L. An exploration on TCM syndrome differentiation rules and clinical syndromes distribution of hyperlipidemia. Zhong Yi Ling Chuang Za Zhi 2017; 7: 47-8. |
| 50 | Simar D, Chen H, Lambert K, Mercier J, Morris MJ. Interaction between maternal obesity and post-natal over-nutrition on skeletal muscle metabolism. Nutr Metab Cardiovasc Dis 2011; 22: 269-76. |
| 51 |
Chan YL, Saad S, Simar D, et al. Short term exendin-4 treatment reduces markers of metabolic disorders in female offspring of obese rat dams. Int J Dev Neurosci 2015; 46: 67-75.
DOI PMID |
| 52 | Pullinger CR, Eng C, Salen G, et al. Human cholesterol 7 alpha-hydroxylase (CYP7A1) deficiency has a hypercholesterolemic phenotype. J Clin Invest 2002; 1: 109-17. |
| 53 | Li T, Owsley E, Matozel M, Hsu P, Novak CM, Chiang JY. Transgenic expression of cholesterol 7alpha-hydroxylase in the liver prevents high-fat diet-induced obesity and insulin resistance in mice. Hepatology 2010; 2: 678-90. |
| [1] | ZHU Lingyan, WEI Yihong, WANG Youhua, YANG Jianmei, LI Jiawei, CAO Min, ZHOU Duan. Protective efficacy of Shenge San (参蛤散) on mitochondria in H9c2 cardiomyocytes [J]. Journal of Traditional Chinese Medicine, 2022, 42(6): 892-899. |
| [2] | HENG Xianpei, LI Liang, YANG Liuqin, WANG Zhita. Efficacy of Dangua Fang (丹瓜方) on endothelial cells damaged by oxidative stress [J]. Journal of Traditional Chinese Medicine, 2022, 42(6): 900-907. |
| [3] | Hu Lei, Wang Lina, Wei Jianzi, Ryszard Grygorczyk, Shen Xueyong, Wolfgang Schwarz. Heat induces adenosine triphosphate release from mast cells in vitro:a putative mechanism for moxibustion [J]. Journal of Traditional Chinese Medicine, 2015, 35(03): 323-328. |
| [4] | HaibinWu, Shifeng She, Youzhang Liu, Wensheng Xiong, Yalei Guo, Huansong Fang, Hong Chen, Jia Li. Protective effect of Sijunzi decoction on neuromuscular junction ultrastructure in autoimmune myasthenia gravis rats [J]. Journal of Traditional Chinese Medicine, 2013, 33(05): 669-673. |
| Viewed | ||||||
|
Full text |
|
|||||
|
Abstract |
|
|||||