Journal of Traditional Chinese Medicine ›› 2024, Vol. 44 ›› Issue (3): 545-553.DOI: 10.19852/j.cnki.jtcm.20240308.004
• Original articles • Previous Articles Next Articles
Clinical efficacy and gene chip expression analysis of Shenzhu Guanxin recipe granules (参术冠心方颗粒) in patients with intermediate coronary lesions
JIN Xiao1, WU Bingxin2, LIN Miaoyang2, ZHONG Biying2, LIN Luoqi2, XU Danping3( )
)
- 1 Department of Traditional Chinese Medicine, the First Affiliated Hospital of Jinan University, Jinan University, Guangzhou 510630, China
2 Department of Cardiology, Second Clinical College of Guangzhou University of Chinese Medicine, Guangzhou 510000, China
3 Department of Traditional Chinese Medicine, the Eighth Affiliated Hospital, Sun Yat-Sen University, Shenzhen 518033, China
-
Received:2022-10-22Accepted:2023-02-10Online:2024-06-15Published:2024-03-08 -
Contact:XU Danping, Department of Traditional Chinese Medicine, the Eighth Affiliated Hospital, Sun Yat-Sen University, Shenzhen 518033, China.xudanping@hotmail.com Telephone: +86-755-83982222 -
Supported by:Traditional Chinese Medicine Bureau of Guangdong Province: Research on the Mechanism of Shen Shu Guan Xin Fang in Reducing Hypoxia Induced Myocardial Cell Injury by Regulating miR-24(20221108);Science and Technology Projects in Guangzhou: Exploring the Intervention of Shenzhu Guanxin Formula on Myocardial Ischemia Based on MiR-24 Mediated Bim/Caspase Apoptosis Signal Pathway Mechanism Research(202201010521);Science and Technology Innovation Projects of Shenzhen: to Study the Mechanism of Hesperidin in Improving Heart Failure Based on Myocardial Inflammation Mediated by MtDNA-sGAS-STING Signaling Pathway(JCYJ20220530144212026);Futian Healthcare Research Project: To Study the Anti-atherosclerosis Effects and Mechanism of Shenzhu Guanxin Decoction on Inhibiting Platelet-mediated Inflammation Based on the Theory of "Phlegm-stasis Interjunction"(FTWS2022012)
Cite this article
JIN Xiao, WU Bingxin, LIN Miaoyang, ZHONG Biying, LIN Luoqi, XU Danping. Clinical efficacy and gene chip expression analysis of Shenzhu Guanxin recipe granules (参术冠心方颗粒) in patients with intermediate coronary lesions[J]. Journal of Traditional Chinese Medicine, 2024, 44(3): 545-553.
share this article
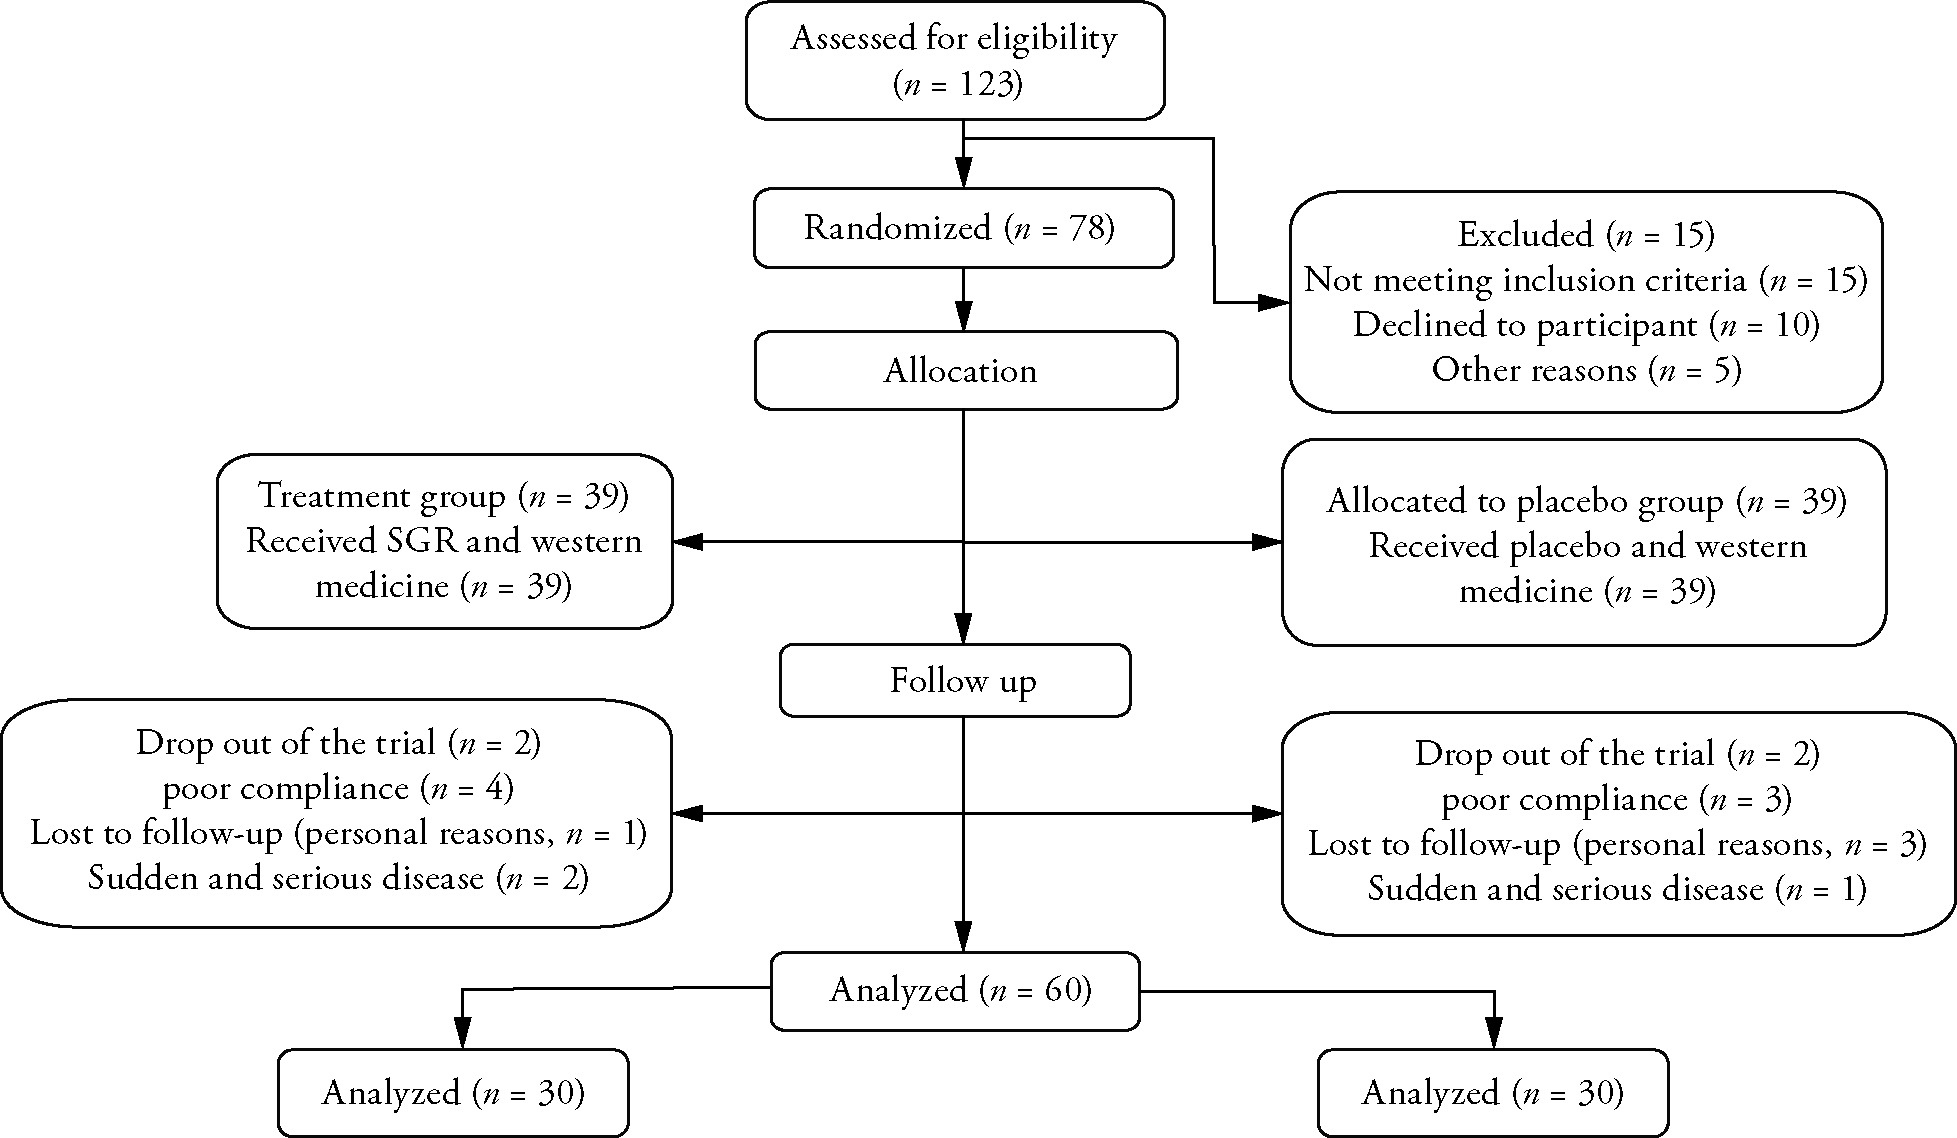
Figure 1 Study flow diagram SGR: Shenshu Guanxin recipe granules.
Figure 1 Study flow diagram SGR: Shenshu Guanxin recipe granules.
Table 1 Comparison of baseline characteristics between the two groups ($\bar{x} \pm s$)
| Item | Case (n = 30) | Control (n = 30) | Statistical value | P value |
|---|---|---|---|---|
| Age (years) | 61.1±7.6 | 63.7±6.5 | 1.409 | 0.238 |
| Gender (male/female, n) | 9:21 | 12:18 | 0.659 | 0.417 |
| Height (cm) | 165.0±7.5 | 164.4±7.6 | -0.354 | 0.574 |
| Weight (kg) | 64.4±8.0 | 60.6±7.1 | -1.924 | 0.059 |
| Disease course (years) | 3.1±3.5 | 2.0±1.7 | -1.62 | 0.111 |
Table 2 Related indexes of CCTA ($\bar{x} \pm s$)
| Index | Case (n = 30) | Control (n = 30) | P value between the groups after treatment | |||||
|---|---|---|---|---|---|---|---|---|
| Before treatment | After treatment | Before treatment | After treatment | |||||
| Transmural gradient of Myocardial perfusion | 1.00±0.10 | 1.01±0.07 | 0.98±0.10 | 1.00±0.12 | 0.642 | |||
| CT value of aortic root | 626.89±132.43 | 663.87±127.10 | 660.30±98.49 | 675.47±89.97 | 0.685 | |||
| CT value of left ventricular | 576.74±160.36 | 638.67±178.49 | 604.32±173.25 | 620.09±156.78 | 0.670 | |||
Table 3 Comparison of level of blood lipids ($\bar{x} \pm s$)
| Group | Time | Triglycerides | Total Cholesterol | Low Density Lipoprotein | High Density Lipoprotein |
|---|---|---|---|---|---|
| Case (n =30) | Before treatment | 1.5±0.7 | 4.4±1.0 | 2.8±0.9 | 1.2±0.3 |
| After treatment | 1.5±0.8 | 3.7±0.5ab | 2.4±0.6ab | 1.3±0.5 | |
| Control (n =30) | Before treatment | 1.8±1.5 | 4.7±1.2 | 3.0±1.1 | 1.3±0.4 |
| After treatment | 1.9±1.1 | 4.2±0.7ab | 2.8±0.7ab | 1.2±0.4 |
Table 4 Comparison of Seattle Angina scale scores ($\bar{x} \pm s$)
| Group | Time | PL | AS | AF | TS | DP |
|---|---|---|---|---|---|---|
| Case (n = 30) | Before treatment | 65±19 | 43±16 | 55±20 | 62±17 | 37±14 |
| After treatment | 78±18ab | 55±20ab | 76±17ab | 75±14ab | 51±18ab | |
| Control (n = 30) | Before treatment | 64±19 | 43±14 | 56±18 | 61±15 | 38±15 |
| After treatment | 65±17ab | 47±16ab | 56±15ab | 63±15ab | 39±13ab |
Table 5 Comparison of TCM syndrome score and the level of hsCRP ($\bar{x} \pm s$)
| Item | Group | n | Before treatment | After treatment | P value compared with baseline | P value between the groups |
|---|---|---|---|---|---|---|
| TCM syndrome score | Case | 30 | 15.7±6.0 | 5.9±3.5 | <0.001 | 0.011 |
| Control | 30 | 14.9±5.9 | 8.3±4.3 | <0.001 | ||
| hs-CRP | Case | 30 | 1.8±1.7 | 3.7±2.7 | 0.162 | 0.426 |
| Control | 30 | 4.6±3.2 | 3.2±2.0 | 0.183 |

Figure 2 Heatmap of differentially expressed mRNA, lncRNA and circRNA A: heatmap of differentially expressed mRNA; B: heatmap of differentially expressed lncRNA; C: heatmap of differentially expressed mRNA; mRNA: messenger RNA; lncRNA: long noncoding RNA; circRNA: circular RNA.
Figure 2 Heatmap of differentially expressed mRNA, lncRNA and circRNA A: heatmap of differentially expressed mRNA; B: heatmap of differentially expressed lncRNA; C: heatmap of differentially expressed mRNA; mRNA: messenger RNA; lncRNA: long noncoding RNA; circRNA: circular RNA.
Table 6 15 differentially expressed mRNA with the largest |log2FC| value
| GeneSymbol | P value | log2FC | Regulation |
|---|---|---|---|
| CD300H | 0.04908781 | -1.744017293 | Down |
| LOC283710 | 0.018101732 | -1.433638427 | Down |
| SLC22A1 | 0.019721809 | -1.42412257 | Down |
| SYTL4 | 0.002548443 | -1.382725044 | Down |
| CACNA1G | 0.044140794 | -1.355298456 | Down |
| ARHGEF10L | 0.03580098 | -1.254431345 | Down |
| TRIM7 | 0.027705062 | -1.241346051 | Down |
| OXTR | 0.019750795 | -1.240223741 | Down |
| CLEC12B | 0.039680333 | -1.227144764 | Down |
| ISL2 | 0.009444028 | -1.210483082 | Down |
| FAM20C | 0.041784465 | -1.169360968 | Down |
| PSRC1 | 0.021503422 | -1.165172062 | Down |
| ZDHHC11B | 0.004670639 | -1.149811385 | Down |
| CERS3 | 0.024225718 | -1.121712191 | Down |
| MXRA7 | 0.028407665 | -1.112152037 | Down |
| ULK3 | 0.048575733 | 1.012987918 | Up |
| MAGEA4 | 0.043658212 | 1.01443464 | Up |
| VPS33B | 0.014616993 | 1.01854859 | Up |
| OR13H1 | 0.006583539 | 1.02698403 | Up |
| FRMD1 | 0.018293367 | 1.061581726 | Up |
| COL11A2 | 0.009761185 | 1.067258947 | Up |
| GRAMD1C | 0.010157319 | 1.077156038 | Up |
| PCDHGA8 | 0.036312011 | 1.109755398 | Up |
| LGI4 | 0.026822805 | 1.123034554 | Up |
| KRT40 | 0.013562152 | 1.126128641 | Up |
| CCDC62 | 0.03875718 | 1.132531901 | Up |
| DNAJC6 | 0.043068924 | 1.146810891 | Up |
| MTRNR2L4 | 0.040007032 | 1.176296984 | Up |
| SLC28A1 | 0.048143021 | 1.177818657 | Up |
| MAS1L | 0.031043932 | 1.190467029 | Up |
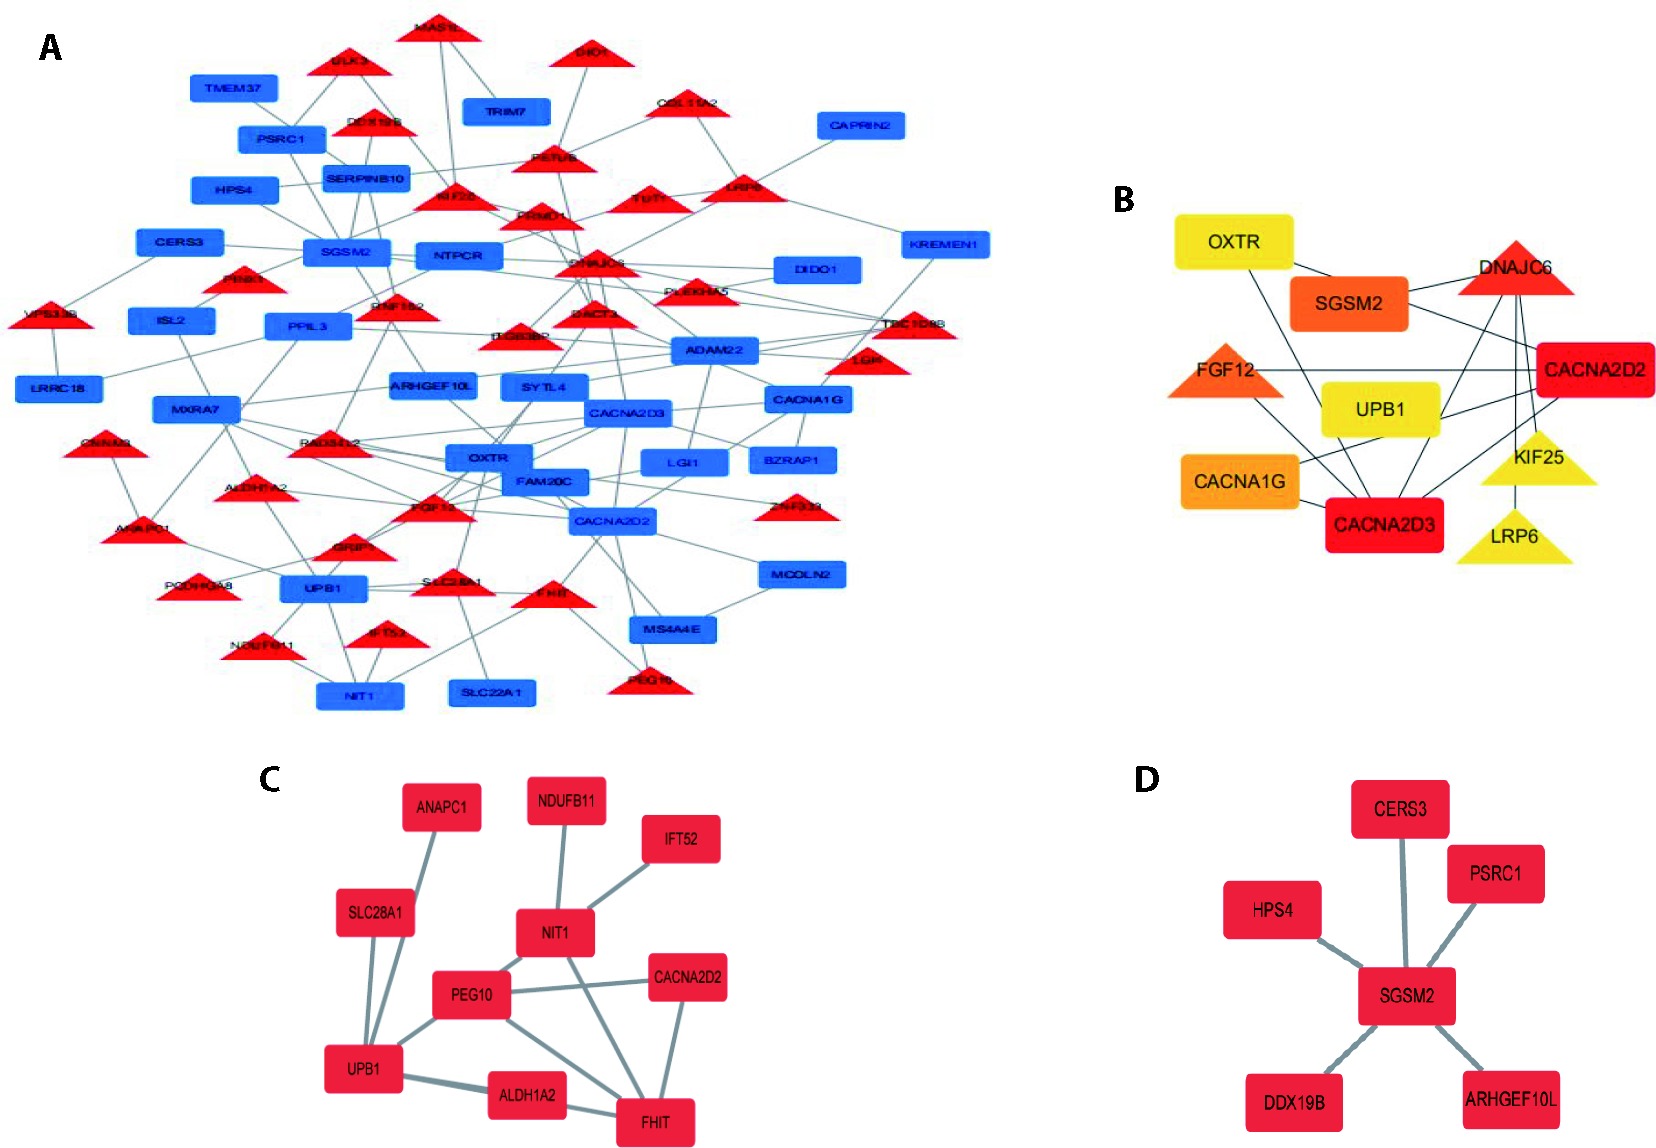
Figure 3 Protein interaction network analysis and 10 hub genes map A: PPI network of all DEGs by STRING website, visualized by Cytoscape. The red nodes stand for upregulated genes while the green nodes stand for downregulated genes; B: top 10 hub genes filtered by cytohubba and combining 12 algorithms; C: significant modules identified from the whole PPI network by the molecular complex detection MCODE. PPI: protein-protein interaction network; DEGs: differentially expressed genes; MCODE: molecular complex detection.
Figure 3 Protein interaction network analysis and 10 hub genes map A: PPI network of all DEGs by STRING website, visualized by Cytoscape. The red nodes stand for upregulated genes while the green nodes stand for downregulated genes; B: top 10 hub genes filtered by cytohubba and combining 12 algorithms; C: significant modules identified from the whole PPI network by the molecular complex detection MCODE. PPI: protein-protein interaction network; DEGs: differentially expressed genes; MCODE: molecular complex detection.

Figure 4 GO enrichment analysis and KEGG analysis of differentially expressed mRNAs A: GO enrichment analysis of differentially expressed mRNAs; B: KEGG analysis of differentially expressed mRNAs. GO: gene ontology; KEGG: Kyoto Encyclopedia of Genes and Genomes; mRNAs: messanger RNAs.
Figure 4 GO enrichment analysis and KEGG analysis of differentially expressed mRNAs A: GO enrichment analysis of differentially expressed mRNAs; B: KEGG analysis of differentially expressed mRNAs. GO: gene ontology; KEGG: Kyoto Encyclopedia of Genes and Genomes; mRNAs: messanger RNAs.
Table 7 Comparison of mRNA gene expression (2 - ?? Ct) between Shenzhu Guanxin formula group and placebo group ($\bar{x} \pm s$)
| mRNA | Case (n = 4) | Control (n = 7) | P value |
|---|---|---|---|
| CEP72 | 2.57±0.37 | 1.11±0.71 | 0.004 |
| DDAH2 | 1.05±0.66 | 1.98±0.52 | 0.03 |
| HDAC5 | 1.33±0.28 | 0.70±0.10 | <0.001 |
| CD300A | 1.34±0.58 | 1.12±0.61 | 0.567 |
| 1. |
Collaborators GCoD. Global, regional, and national age-sex-specific mortality for 282 causes of death in 195 countries and territories, 1980-2017: a systematic analysis for the Global Burden of Disease Study 2017. Lancet 2018; 392: 1736-88.
DOI URL |
| 2. |
Pencina MJ, Navar AM, Wojdyla D, et al. Quantifying importance of major risk factors for coronary heart disease. Circulation 2019; 139: 1603-11.
DOI PMID |
| 3. |
Malakar AK, Choudhury D, Halder B, Paul P, Uddin A, Chakraborty S. A review on coronary artery disease, its risk factors, and therapeutics. J Cell Physiol 2019; 234: 16812-23.
DOI PMID |
| 4. |
Tobis J, Azarbal B, Slavin L. Assessment of intermediate severity coronary lesions in the catheterization laboratory. J Am Coll Cardiol 2007; 49 : 839-48.
DOI PMID |
| 5. |
Neumann FJ, Sousa-Uva M, Ahlsson A, et al. 2018 ESC/EACTS Guidelines on myocardial revascularization. Eur Heart J 2019; 40 : 87-165.
DOI URL |
| 6. |
Valgimigli M, Bueno H, Byrne RA, et al. 2017 ESC focused update on dual antiplatelet therapy in coronary artery disease developed in collaboration with EACTS. Eur Heart J 2018; 39: 213-60.
DOI URL |
| 7. | Yang X, He T, Han S, et al. The Role of Traditional Chinese Medicine in the regulation of oxidative stress in treating coronary heart disease. Oxid Med Cell Longev 2019; 2019: 3231424. |
| 8. |
Zhang KJ, Zheng Q, Zhu PC, et al. Traditional Chinese Medicine for coronary heart disease: clinical evidence and possible mechanisms. Front Pharmacol 2019; 10: 844.
DOI URL |
| 9. |
Guo XY, Liu J, Liu J, et al. Use of Traditional Chinese Medicine in Chinese patients with coronary heart disease. Biomed Environ Sci 2013; 26 : 303-10.
DOI PMID |
| 10. |
Xu DP, Wu HL, Lan TH, et al. Effect of Shenzhu Guanxin recipe on patients with angina pectoris after percutaneous coronary intervention: a prospective, randomized controlled trial. Chin J Integr Med 2015; 21: 408-16.
DOI URL |
| 11. | Xu DP, Zou DZ, Qiu HL, Wu HL. Traditional Chinese Medicine Shenzhu Guanxin granules mitigate cardiac dysfunction and promote myocardium angiogenesis in myocardial infarction rats by upregulating PECAM-1/CD31 and VEGF expression. Evid Based Complement Alternat Med 2017; 2017: 5261729. |
| 12. |
Wang X, Ji X. Sample size estimation in clinical research: from randomized controlled trials to observational studies. Chest 2020; 158: S12-20.
DOI PMID |
| 13. |
Go GW. Low-density lipoprotein receptor-related protein 6 (LRP6) is a novel nutritional therapeutic target for hyperlipidemia, non-alcoholic fatty liver disease, and atherosclerosis. Nutrients 2015; 7: 4453-64.
DOI URL |
| 14. | Daskalopoulos EP, Blankesteijn WM. Effect of interventions in WNT signaling on healing of cardiac injury: a systematic review. Cells 2021; 10: 207. |
| 15. |
Abeyrathna P, Su Y. The critical role of Akt in cardiovascular function. Vascul Pharmacol 2015; 74: 38-48.
DOI URL |
| 16. | Ahmad KA, Ze H, Chen J, et al. The protective effects of a novel synthetic β-elemene derivative on human umbilical vein endothelial cells against oxidative stress-induced injury: Involvement of antioxidation and PI3k/Akt/eNOS/NO signaling pathways. Biomed Pharmacother 2018; 106: 1734-41. |
| 17. | Foulquier S, Daskalopoulos EP, Lluri G, Hermans KCM, Deb A, Blankesteijn WM. WNT signaling in cardiac and vascular disease. Pharmacol Rev 2018; 70: 68-141. |
| [1] | HAN Rui, CHANG Junzhao, LIU Qianqian, LIU Haitao, LI Junwei. Efficacy of electroacupunture at Zusanli (ST36) on jumping-injured muscle based on transcriptome sequencing and genes analysis [J]. Journal of Traditional Chinese Medicine, 2023, 43(2): 322-328. |
| [2] | Wang Yili, Tian Yuanxiang, Zhao Jianxin, Xu Lei. Effect of electroacupuncture on gene expression in calcium signaling pathway in hippocampal cells in mice with cerebral ischemia reperfusion [J]. Journal of Traditional Chinese Medicine, 2017, 37(02): 252-260. |
| [3] | Guo Yan, Xie Xiaojia, Guo Changqing, Wang Zhaoyang, Liu Qingguo. Effect of electro-acupuncture on gene expression in heart of rats with stress-induced pre-hypertension based on gene chip technology [J]. Journal of Traditional Chinese Medicine, 2015, 35(03): 285-294. |
| Viewed | ||||||
|
Full text |
|
|||||
|
Abstract |
|
|||||