Journal of Traditional Chinese Medicine ›› 2025, Vol. 45 ›› Issue (3): 639-650.DOI: 10.19852/j.cnki.jtcm.2025.03.017
Previous Articles Next Articles
Clinical observation on edema based on the thermal sensitivity measurement method
TIAN Zheng1( ), DU Jing1, LIAO Wenhao1, LU Jixiang2(), Masayuki Yagi3, Yoshikazu Yonei3
- 1 Chengxintang Clinic, Xi'an 710054, China
2 School of Mechanical Engineering, Northwestern Polytechnical University, Xi'an 710072, China
3 Anti-Aging Medical Research Center and Glycative Stress Research Center, Faculty of Life and Medical Sciences, Doshisha University, Kyoto 610-0321, Japan
-
Received:2024-03-26Accepted:2024-08-20Online:2025-06-15Published:2025-05-21 -
Contact:Dr. TIAN Zheng, Chengxintang Clinic, Xi'an 710054, China. tomtomtom1990@hotmail.com;Dr. LU Jixiang, School of Mechanical Engineering, Northwestern Polytechnical University, Xi'an 710054, China. lujixiang@nwpu.edu.cn,Telephone: +86-29-85267850; +86-13991379319
Cite this article
TIAN Zheng, DU Jing, LIAO Wenhao, LU Jixiang, Masayuki Yagi, Yoshikazu Yonei. Clinical observation on edema based on the thermal sensitivity measurement method[J]. Journal of Traditional Chinese Medicine, 2025, 45(3): 639-650.
share this article
Table 1 Comparison of general information of the three groups
| Variable | Group 1 (with edema) (n = 112) | Group 2 (n = 488) | Group 3 (n = 826) | ||||||
|---|---|---|---|---|---|---|---|---|---|
| Mean | 95% CI | Mean | 95% CI | Mean | 95% CI | ||||
| Age (years) | Total | 46.3 | 10.0, 83.0 | 44.5 | 4.5, 91.0 | 44.1 | 43.3, 45.2 | ||
| Male | 45.2 | 10.0, 83.0 | 45.9 | 4.5, 91.0 | 44.9 | 43.1, 46.7 | |||
| Female | 46.6 | 16.0, 77.0 | 43.6a | 5.0, 81.0 | 43.6a | 42.5, 44.7 | |||
| Height (cm) | Total | 164.7 | 143.0, 185.0 | 165.2 | 108.0, 188.0 | 165.3 | 164.8, 166.6 | ||
| Male | 172.9 | 143.0, 185.0 | 171.9 | 108.0, 188.0 | 172.9 | 172.0, 173.8 | |||
| Female | 162.2 | 152.0, 173.0 | 160.9 | 109.0, 178.0 | 164.1 | 158.6, 169.7 | |||
| Weight (kg) | Total | 63.4 | 29.6, 99.7 | 64.3 | 16.7, 119.6 | 61.7 | 61.3, 63.3 | ||
| Male | 76.4 | 29.6, 99.7 | 74.4 | 20.0, 119.6 | 71.2 | 69.5, 72.8 | |||
| Female | 59.5 | 41.0, 81.2 | 57.9 | 16.7, 102.6 | 56.2c | 55.3, 57.1 | |||
| BMI | Total | 23.3 | 14.5, 31.8 | 23.5 | 14.8, 39.1 | 29.9b | 19.5, 35.9 | ||
| Male | 25.3 | 14.5, 31.8 | 25.2 | 16.1, 38.6 | 23.7a | 23.2, 24.1 | |||
| Female | 22.6 | 16.0, 29.5 | 22.4 | 14.8, 39.1 | 21.5c | 21.2, 21.8 | |||
Table 2 Breakdown of diseases and symptoms (n)
| Variable | Group 1 (n = 112) | Group 2 (n = 488) | Group 3 (n = 826) | |||||||||
|---|---|---|---|---|---|---|---|---|---|---|---|---|
| Total | Male | Female | Total | Male | Female | Total | Male | Female | ||||
| Number | 112 | 26 | 86 | 488 | 190 | 298 | 826 | 296 | 530 | |||
| Edema | 112 | 26 | 86 | 0 | 0 | 0 | 0 | 0 | 0 | |||
| Constipation | 10 | 1 | 9 | 57 | 14 | 43 | 0 | 0 | 0 | |||
| Insomnia | 11 | 2 | 9 | 96 | 40 | 56 | 0 | 0 | 0 | |||
| Nephropathy | 40 | 12 | 28 | 163 | 72 | 91 | 0 | 0 | 0 | |||
| Gastritis | 8 | 1 | 7 | 38 | 1 | 37 | 0 | 0 | 0 | |||
| Cardiac disease | 68 | 10 | 58 | 259 | 94 | 165 | 0 | 0 | 0 | |||
| Diabetes | 3 | 1 | 2 | 15 | 7 | 8 | 0 | 0 | 0 | |||
Table 3 Value of TSM of the twelve meridians in each group
| Meridian | Abbreviation | Group 1 (with edema) (n = 112) | Group 2 (n = 488) | Group 3 (n = 826) | ||||||
|---|---|---|---|---|---|---|---|---|---|---|
| Mean | 95% CI | Mean | 95% CI | Mean | 95% CI | |||||
| Lung | LU | left | 7.3 | 6.6, 7.9 | 7.8 | 7.5, 8.2 | 13.4a | 13.4, 14.0 | ||
| right | 7.3 | 6.2, 8.3 | 8.0 | 7.5, 8.5 | 14.5a | 14.5, 15.2 | ||||
| Large Intestine | LI | left | 6.7 | 6.0, 7.4 | 7.6 | 7.3, 7.9 | 12.5a | 12.5, 13.1 | ||
| right | 6.9 | 5.9, 8.0 | 7.6 | 7.2, 8.0 | 13.3a | 13.3, 13.9 | ||||
| Pericardium | PC | left | 6.9 | 6.3, 7.5 | 7.9 | 7.4, 8.3 | 11.8a | 11.8, 12.2 | ||
| right | 6.7 | 6.1, 7.3 | 7.7 | 7.4, 8.1 | 13.2a | 13.2, 13.6 | ||||
| Sanjiao | SJ | left | 6.8 | 6.2, 7.3 | 7.4 | 7.0, 7.7 | 13.5a | 13.5, 14.1 | ||
| right | 6.9 | 6.2, 7.6 | 7.7 | 7.3, 8.0 | 11.3a | 11.3, 11.8 | ||||
| Heart | HT | left | 7.0 | 5.9, 8.0 | 7.3 | 7.0, 7.6 | 11.9a | 11.9, 12.4 | ||
| right | 6.8 | 6.0, 7.6 | 7.3 | 6.9, 7.7 | 12.3a | 12.3, 12.8 | ||||
| Small Intestine | SI | left | 6.7 | 5.7, 7.7 | 6.9 | 6.6, 7.3 | 14.1a | 14.1, 14.8 | ||
| right | 6.4 | 5.8, 7.0 | 7.3 | 7.0, 7.7 | 12.3a | 12.3, 13.0 | ||||
| Spleen | SP | left | 9.8 | 8.5, 11.1 | 10.2 | 9.7, 10.8 | 14.1a | 14.1, 14.6 | ||
| right | 9.3 | 8.4, 10.2 | 10.5 | 9.9, 11.1 | 15.9a | 15.9, 16.5 | ||||
| Liver | LR | left | 8.3 | 7.6, 9.0 | 9.1 | 8.7, 9.5 | 14.7a | 14.7, 15.2 | ||
| right | 8.0 | 7.2, 8.7 | 8.7 | 8.2, 9.1 | 12.2a | 12.2, 12.7 | ||||
| Stomach | ST | left | 8.4 | 7.7, 9.2 | 9.6 | 9.0, 10.2 | 14.5a | 14.5, 15.0 | ||
| right | 8.0 | 7.3, 8.7 | 9.4 | 8.9, 9.9 | 13.6a | 13.6, 14.1 | ||||
| Gallbladder | GB | left | 10.3 | 9.0, 11.5 | 10.6 | 10.0, 11.1 | 15.3a | 15.3, 15.9 | ||
| right | 9.3 | 8.4, 10.1 | 10.4 | 9.8, 11.0 | 14.8a | 14.8, 15.4 | ||||
| Bladder | BL | left | 13.4 | 11.8, 15.0 | 15.0 | 14.2, 15.9 | 18.0b | 18.0, 18.7 | ||
| right | 14.2 | 12.2, 16.2 | 14.7 | 13.8, 15.7 | 17.5 | 17.5, 18.2 | ||||
| Kidney | KI | left | 15.4 | 13.5, 17.4 | 17.5 | 16.6, 18.5 | 18.1 | 18.1, 18.7 | ||
| right | 16.2 | 14.2, 18.1 | 16.6 | 15.7, 17.5 | 16.6c | 16.6, 17.2 | ||||
Table 4 Evaluation of three classifications of TSM values: comparison of the presence of edema of hand
| Left/ right | LU | Sensitivity (%) | LI | Sensitivity (%) | PC | Sensitivity (%) | SJ | Sensitivity (%) | HT | Sensitivity (%) | SI | Sensitivity (%) |
|---|---|---|---|---|---|---|---|---|---|---|---|---|
| AA | 65 | 58.0 | 72 | 64.3 | 65 | 58.0 | 66 | 58.9 | 67 | 59.8 | 69 | 61.6 |
| AB | 9 | 8.0 | 7 | 6.3 | 9 | 8.0 | 12 | 10.7 | 12 | 10.7 | 14 | 12.5 |
| AC | 0 | 0.0 | 0 | 0.0 | 0 | 0.0 | 1 | 0.9 | 1 | 0.9 | 1 | 0.9 |
| BA | 14 | 12.5 | 13 | 11.6 | 16 | 14.3 | 13 | 11.6 | 16 | 14.3 | 14 | 12.5 |
| BB | 14 | 12.5 | 13 | 11.6 | 13 | 11.6 | 15 | 13.4 | 12 | 10.7 | 12 | 10.7 |
| BC | 4 | 3.6 | 3 | 2.7 | 5 | 4.5 | 3 | 2.7 | 2 | 1.8 | 0 | 0.0 |
| CA | 2 | 1.8 | 0 | 0.0 | 1 | 0.9 | 1 | 0.9 | 1 | 0.9 | 0 | 0.0 |
| CB | 1 | 0.9 | 1 | 0.9 | 1 | 0.9 | 0 | 0.0 | 0 | 0.0 | 0 | 0.0 |
| CC | 3 | 2.7 | 3 | 2.7 | 2 | 1.8 | 1 | 0.9 | 1 | 0.9 | 2 | 1.8 |
Table 5 Evaluation of three classifications of TSM values: comparison of the presence of group 2 without edema of hand
| Left/ right | LU | Specificity | LI | Specificity | PC | Specificity | SJ | Specificity | HT | Specificity | SI | Specificity |
|---|---|---|---|---|---|---|---|---|---|---|---|---|
| AA | 220 | 54.9 | 243 | 50.2 | 227 | 53.5 | 250 | 48.8 | 249 | 49.0 | 265 | 45.7 |
| AB | 57 | 88.3 | 43 | 91.2 | 51 | 89.5 | 56 | 88.5 | 57 | 88.3 | 59 | 87.9 |
| AC | 3 | 99.4 | 4 | 99.2 | 1 | 99.8 | 4 | 99.2 | 5 | 99.0 | 5 | 99.0 |
| BA | 74 | 84.8 | 67 | 86.3 | 70 | 85.7 | 47 | 90.4 | 68 | 86.1 | 54 | 88.9 |
| BB | 82 | 83.2 | 73 | 85.0 | 77 | 84.2 | 82 | 83.2 | 65 | 86.7 | 64 | 86.9 |
| BC | 18 | 96.3 | 21 | 95.7 | 19 | 96.1 | 18 | 96.3 | 18 | 96.3 | 19 | 96.1 |
| CA | 4 | 99.2 | 6 | 98.8 | 5 | 99.0 | 2 | 99.6 | 6 | 98.8 | 2 | 99.6 |
| CB | 15 | 96.9 | 13 | 97.3 | 16 | 96.7 | 10 | 98.0 | 12 | 97.5 | 9 | 98.2 |
| CC | 15 | 96.9 | 18 | 96.3 | 22 | 95.5 | 19 | 96.1 | 8 | 98.4 | 11 | 97.7 |
Table 6 Evaluation of three classifications of TSM values: comparison of the presence of group 3 without edema and underlying diseases of hand
| Left/ right | LU | Specificity | LI | Specificity | PC | Specificity | SJ | Specificity | HT | Specificity | SI | Specificity |
|---|---|---|---|---|---|---|---|---|---|---|---|---|
| AA | 30 | 96.4 | 58 | 93.0 | 32 | 96.1 | 43 | 94.8 | 61 | 92.6 | 84 | 89.8 |
| AB | 50 | 93.9 | 62 | 92.5 | 65 | 92.1 | 30 | 96.4 | 66 | 92.0 | 44 | 94.7 |
| AC | 13 | 98.4 | 11 | 98.7 | 20 | 97.6 | 3 | 99.6 | 12 | 98.5 | 6 | 99.3 |
| BA | 45 | 94.6 | 47 | 94.3 | 36 | 95.6 | 101 | 87.8 | 50 | 93.9 | 88 | 89.3 |
| BB | 240 | 70.9 | 245 | 70.3 | 271 | 67.2 | 233 | 71.8 | 277 | 66.5 | 216 | 73.8 |
| BC | 124 | 85.0 | 119 | 85.6 | 146 | 82.3 | 69 | 91.6 | 107 | 87.0 | 47 | 94.3 |
| CA | 4 | 99.5 | 6 | 99.3 | 3 | 99.6 | 47 | 94.3 | 14 | 98.3 | 35 | 95.8 |
| CB | 107 | 87.0 | 92 | 88.9 | 74 | 91.0 | 139 | 83.2 | 84 | 89.8 | 114 | 86.2 |
| CC | 213 | 74.2 | 186 | 77.5 | 179 | 78.3 | 161 | 80.5 | 155 | 81.2 | 192 | 76.8 |
Table 7 Evaluation of three classifications of TSM values: comparison of the presence of group 1 with edema of foot
| Left/ right | SP | Sensitivity | LR | Sensitivity | ST | Sensitivity | GB | Sensitivity | BL | Sensitivity | KI | Sensitivity |
|---|---|---|---|---|---|---|---|---|---|---|---|---|
| AA | 36 | 32.1 | 43 | 38.4 | 42 | 37.5 | 29 | 25.9 | 13 | 11.6 | 11 | 9.8 |
| AB | 13 | 11.6 | 14 | 12.5 | 14 | 12.5 | 5 | 4.5 | 6 | 5.4 | 3 | 2.7 |
| AC | 1 | 0.9 | 1 | 0.9 | 1 | 0.9 | 0 | 0.0 | 1 | 0.9 | 6 | 5.4 |
| BA | 9 | 8.0 | 19 | 17.0 | 14 | 12.5 | 17 | 15.2 | 7 | 6.3 | 5 | 4.5 |
| BB | 25 | 22.3 | 17 | 15.2 | 25 | 22.3 | 25 | 22.3 | 27 | 24.1 | 11 | 9.8 |
| BC | 4 | 3.6 | 4 | 3.6 | 4 | 3.6 | 10 | 8.9 | 11 | 9.8 | 16 | 14.3 |
| CA | 4 | 3.6 | 2 | 1.8 | 1 | 0.9 | 3 | 2.7 | 2 | 1.8 | 3 | 2.7 |
| CB | 7 | 6.3 | 4 | 3.6 | 6 | 5.4 | 10 | 8.9 | 13 | 11.6 | 15 | 13.4 |
| CC | 13 | 11.6 | 8 | 7.1 | 5 | 4.5 | 13 | 11.6 | 32 | 28.6 | 42 | 37.5 |
Table 8 Evaluation of three classifications of TSM values: comparison of the presence of group 2 without edema of foot
| Left/ right | SP | Specificity | LR | Specificity | ST | Specificity | GB | Specificity | BL | Specificity | KI | Specificity |
|---|---|---|---|---|---|---|---|---|---|---|---|---|
| AA | 115 | 76.4 | 171 | 65.0 | 161 | 67.0 | 114 | 76.6 | 44 | 91.0 | 24 | 95.1 |
| AB | 57 | 88.3 | 40 | 91.8 | 47 | 90.4 | 40 | 91.8 | 24 | 95.1 | 25 | 94.9 |
| AC | 1 | 99.8 | 3 | 99.4 | 7 | 98.6 | 7 | 98.6 | 3 | 99.4 | 11 | 97.7 |
| BA | 51 | 89.5 | 75 | 84.6 | 54 | 88.9 | 51 | 89.5 | 25 | 94.9 | 23 | 95.3 |
| BB | 115 | 76.4 | 103 | 78.9 | 103 | 78.9 | 122 | 75.0 | 110 | 77.5 | 64 | 86.9 |
| BC | 38 | 92.2 | 21 | 95.7 | 32 | 93.4 | 39 | 92.0 | 43 | 91.2 | 54 | 88.9 |
| CA | 6 | 98.8 | 4 | 99.2 | 3 | 99.4 | 5 | 99.0 | 5 | 99.0 | 6 | 98.8 |
| CB | 37 | 92.4 | 24 | 95.1 | 38 | 92.2 | 40 | 91.8 | 62 | 87.3 | 56 | 88.5 |
| CC | 68 | 86.1 | 47 | 90.4 | 43 | 91.2 | 70 | 85.7 | 172 | 64.8 | 225 | 53.9 |
Table 9 Evaluation of three classifications of TSM values: comparison of the presence of group 3 without edema and underlying diseases of foot
| Left/ right | SP | Specificity (%) | LR | Specificity (%) | ST | Specificity (%) | GB | Specificity (%) | BL | Specificity (%) | KI | Specificity (%) |
|---|---|---|---|---|---|---|---|---|---|---|---|---|
| AA | 32 | 96.1 | 51 | 93.8 | 50 | 93.9 | 46 | 94.4 | 16 | 98.1 | 15 | 98.2 |
| AB | 44 | 94.7 | 26 | 96.9 | 27 | 96.7 | 21 | 97.5 | 18 | 97.8 | 25 | 97.0 |
| AC | 12 | 98.5 | 1 | 99.9 | 5 | 99.4 | 5 | 99.4 | 7 | 99.2 | 3 | 99.6 |
| BA | 21 | 97.5 | 70 | 91.5 | 53 | 93.6 | 24 | 97.1 | 22 | 97.3 | 18 | 97.8 |
| BB | 170 | 79.4 | 208 | 74.8 | 190 | 77.0 | 162 | 80.4 | 112 | 86.4 | 106 | 87.2 |
| BC | 138 | 83.3 | 41 | 95.0 | 77 | 90.7 | 87 | 89.5 | 93 | 88.7 | 62 | 92.5 |
| CA | 3 | 99.6 | 13 | 98.4 | 14 | 98.3 | 9 | 98.9 | 7 | 99.2 | 10 | 98.8 |
| CB | 71 | 91.4 | 172 | 79.2 | 122 | 85.2 | 144 | 82.6 | 109 | 86.8 | 128 | 84.5 |
| CC | 335 | 59.4 | 244 | 70.5 | 288 | 65.1 | 328 | 60.3 | 442 | 46.5 | 459 | 44.4 |
Table 10 Logistic multiple regression analysis of TSM values
| Variable | Groups 1 & 3 | All the groups (Groups 1, 2 & 3) | ||||||
|---|---|---|---|---|---|---|---|---|
| Odds | 95% CI | Odds | 95% CI | Odds | 95% CI | |||
| Sex (male: 1, female: 0) | 1.05 | 0.55, 2.03 | 0.45a | 0.27, 0.76 | ||||
| Age (years) | 1.03a | 1.01, 1.05 | 1.03a | 1.01, 1.05 | 1.00 | 0.99, 1.01 | ||
| LU | Left | 0.80a | 0.68, 0.94 | 0.81a | 0.71, 1.05 | 1.00 | 0.91, 1.10 | |
| Right | 1.03 | 0.96, 1.11 | 1.01 | 0.94, 1.08 | ||||
| LI | Left | 0.95 | 0.81, 1.12 | 0.87b | 0.75, 1.00 | |||
| Right | 0.97 | 0.80, 1.17 | 1.06 | 0.97, 1.16 | ||||
| PC | Left | 1.07 | 0.90, 1.26 | 0.99 | 0.87, 1.12 | |||
| Right | 0.81b | 0.67, 0.97 | 0.81a | 0.69, 0.95 | 0.83a | 0.72, 0.96 | ||
| SJ | Left | 0.68c | 0.56, 0.83 | 0.65c | 0.54, 0.79 | 0.88b | 0.77, 1.00 | |
| Right | 1.1 | 0.97, 1.26 | 1.03 | 0.91, 1.16 | ||||
| HT | Left | 0.98 | 0.77, 1.24 | 1.08 | 0.98, 1.20 | |||
| Right | 0.89d | 0.77, 1.02 | 1.03 | 0.94, 1.12 | ||||
| SI | Left | 1.00 | 0.92, 1.09 | 1.02 | 0.96, 1.08 | |||
| Right | 1.00 | 0.93, 1.09 | 0.95 | 0.85, 1.06 | ||||
| SP | Left | 1.06 | 0.96, 1.17 | 1.04 | 0.99, 1.10 | |||
| Right | 0.91d | 0.81, 1.02 | 0.99 | 0.92, 1.06 | ||||
| LR | Left | 0.75c | 0.67, 0.85 | 0.81c | 0.74, 0.89 | 0.92 | 0.83, 1.02 | |
| Right | 1.24c | 1.11, 1.39 | 1.19a | 1.07, 1.31 | 1.04d | 0.99, 1.09 | ||
| ST | Left | 1.02 | 0.93, 1.12 | 0.98 | 0.91, 1.06 | |||
| Right | 0.99 | 0.84, 1.16 | 0.92d | 0.84, 1.00 | ||||
| GB | Left | 0.96 | 0.86, 1.08 | 1.03 | 0.98, 1.07 | |||
| Right | 0.91b | 0.83, 1.00 | 0.90a | 0.84, 0.97 | 0.99 | 0.92, 1.07 | ||
| BL | Left | 1.05 | 1.00, 1.11 | 0.99 | 0.95, 1.03 | |||
| Right | 1.11c | 1.06, 1.17 | 1.11c | 1.07, 1.16 | 1.02 | 0.99, 1.05 | ||
| KI | Left | 1.03 | 0.99, 1.08 | 1.00 | 0.97, 1.03 | |||
| Right | 1.13a | 1.05, 1.21 | 1.12c | 1.07, 1.17 | 1.03d | 1.00, 1.06 | ||
| ROC analysis | AUC | 0.97c | 0.95, 0.98 | 0.96c | 0.93, 0.98 | 0.84c | 0.81, 0.87 | |
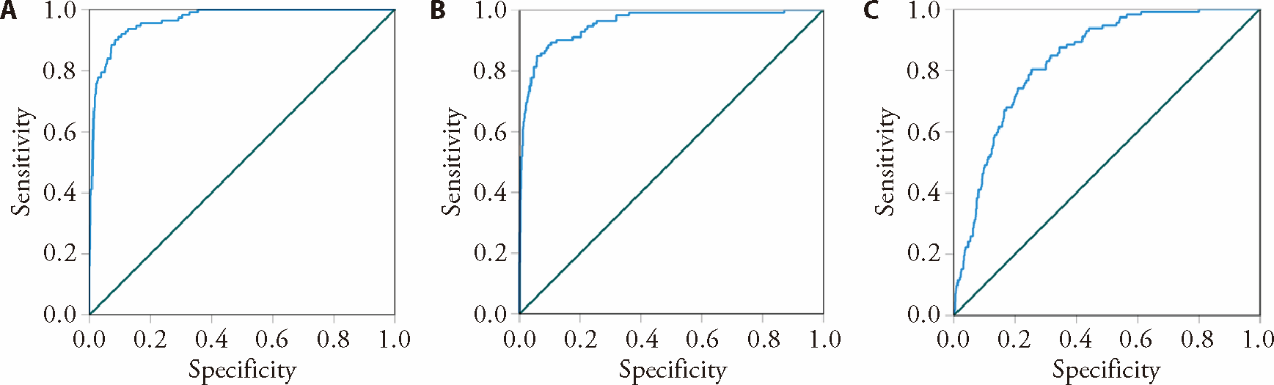
Figure 1 ROC curve A: Group 1 & Group 3 full variate analysis (n = 938). AUC: 0.97; CP: TPF 0.818 & FPF 0.182; B: Group edema & Group 3; stepwise analysis (n = 938). AUC: 0.96; CP: TPF 0.848 & FPF 0.058; C: all the groups (n = 1426). AUC: 0.84; CP: TPF 0.804 & FPF 0.255.Group 1: 112 patients with edema; Group 2: 488 patients with no edema but with underlying disease or symptoms; Group 3: 826 healthy subjects with no edema. CP: closest point from top left corner; BP: basal point; FPF: false positive fraction; TPF: true positive fraction; ROC: receiver operatorating characteristic.
Figure 1 ROC curve A: Group 1 & Group 3 full variate analysis (n = 938). AUC: 0.97; CP: TPF 0.818 & FPF 0.182; B: Group edema & Group 3; stepwise analysis (n = 938). AUC: 0.96; CP: TPF 0.848 & FPF 0.058; C: all the groups (n = 1426). AUC: 0.84; CP: TPF 0.804 & FPF 0.255.Group 1: 112 patients with edema; Group 2: 488 patients with no edema but with underlying disease or symptoms; Group 3: 826 healthy subjects with no edema. CP: closest point from top left corner; BP: basal point; FPF: false positive fraction; TPF: true positive fraction; ROC: receiver operatorating characteristic.
| 1. | Akabane K. Acupuncture and moxibustion therapy by measurement of thermal sensitivity. Shanghai: Shanghai health publishing house, 1956: 1-40. |
| 2. | Akabane K. Acupuncture and moxibustion therapy based on thermal sensitivity measurement method. Japanese medical knowledge. Shanghai: Shanghai health publishing house, 1985: 1-41. |
| 3. | Yan SY, Zhu BX, Li DX, et al. Terminology of Chinese medicine clinical diagnosis and treatment disease section: GB/T 16751 1-1997. Beijing: National Administration of Traditional Chinese Medicine, 1997: 14-5 [Cited 2024-07-09]. Available from URL: https://std.samr.gov.cn/gb/search/gbDetailed?id=F78920661011.B223E05397BE0A0AE533 |
| 4. | Ouyang Q. Clinical diagnostics. Beijing: People's health press, 2010: 14-6. |
| 5. | Zhu WH, Xue CY, Ma WZ, et al. Determination of normal values of twelve well points by the method of knowing heat sensibility. Zhen Ci Yan Jiu 1996; 21: 31-2. |
| 6. | Xu YF, Liu L, Liang YX, et al. Exploration of the use of meridian knowing heat sensibility determination in the identification of insomnia patterns. J Tradit Chin Med 2022; 37: 5456-9. |
| 7. | Zhang JX. Discussion on the use of meridian heat sensibility measurement in the identification and efficacy assessment of Yang deficiency. Guangzhou: Guangzhou university of Traditional Chinese Medicine, 2010: 1-102. |
| 8. | Jin LS. Study on the differences in the sensibility of knowing heat of well points belonging to the five viscera and six bowels in lung cancer patients. Guangzhou: Guangzhou university of Traditional Chinese Medicine, 2013: 1-40. |
| 9. | Gao SZ. Acupuncture and moxibustion therapy. Shanghai: Shanghai science and technology press, 2009: 11. |
| 10. | Li J, Hu CH, Huang T. Lecture notes on medical cases of Li Yangbo. Beijing: China medical science and technology press, 2013: 3-4. |
| 11. | Akabane K. Acupuncture therapy by measurement of thermal sensibility. Shanghai: Shanghai health press, 1956: 12-20. |
| 12. | Li J, Hu CH, Huang T. Li Yang Bo medical records. Beijing: China medical science press, 2013: 3-4. |
| 13. | Lu MH, Su ZX, Wu M, et al. A preliminary study of meridian determination in stroke patients. Shanghai Zhen Jiu Za Zhi 1997; 16-7. |
| 14. | Tian Z, inventor; Meridian quantification tester and detection method. State Intellectual Property Office of China 201710953591. 2017 Oct 8. |
| 15. | Bai XM, Yang HT. Examination and identification of disease names related to renal edema in the yellow emperor's classic of internal medicine. Zhong Guo Zhong Xi Yi Jie He Shen Bing Za Zhi 2014; 15: 93-4. |
| 16. | Zhou ZQ. Internal medicine of Traditional Chinese Medicine. Beijing: China press of Traditional Chinese Medicine, 2007: 333-5. |
| 17. | Sun QF, Su wen. In the swelling trial interpretation. Guiyang Zhong Yi Xue Yuan Xue Bao 1982; 3: 42-4. |
| 18. | Song Xu, Shu W, Pu J, Fen F, Liu JC, Xu SW. Beijing: China press of Traditional Chinese Medicine, 2006: 1-10. |
| 19. | Zhang XC. Yi Xue Zhong Zhong Can Xi Lu. Taiyuan: Shanxi science and technology press, 2009: 88. |
| 20. | Wu JT (Qing dynasty). Wen Bing Tiao Bian. Beijing: People's health publishing house, 2012: 42. |
| 21. | Yin Bin. Discussion on edema disease in the Neijing. Tianjin Zhong Yi Xue Yuan Xue Bao 1991; 2: 3-4. |
| 22. | He R. The Annotations to the essentials of Jin Nian. Beijing: People's health press, 2013: 17-9. |
| 23. | Wang ZY, Yoshibiden KT. Ryojitsuro: Differences in the meridians of the internal organs based on the measurement of the sense of heat. J Neurol Sci 1995; 40: 147-9. |
| 24. | Wang WJ, DU YJ. Current status and clinical application prospect of the method of knowing heat sensibility determination. Zhong Guo Zhen Jiu 2016; 36: 641-4. |
| 25. | Akabane K. Observations on meridian changes based on the method of knowing heat sensibility measurement. Trad Kampo Med 1951; 2: 20-32. |
| 26. | Akabane K. Acupuncture and moxibustion treatment method based on the measurement of sensory heat sensibility. J Med Sci 1985; 1: 1-41. |
| 27. | Akabane K. Scientific advancement of acupuncture 1. I Do Japan 1951; 10: 12-22. |
| 28. | Ichiro S, Haruka K, Kazumi K. Determination of meridian changes using the method of knowing heat sensibility measurement. J Soc Assoc Sch Orient Therap 2016; 39: 164-7. |
| 29. | Tian NX, Xu Y, Yang JY, et al. KChIP3 N-Terminal 31-50 fragment mediates its association with TRPV1 and alleviates inflammatory hyperalgesia in rats. J Neurosci 2018; 38: 1756-73. |
| Viewed | ||||||
|
Full text |
|
|||||
|
Abstract |
|
|||||